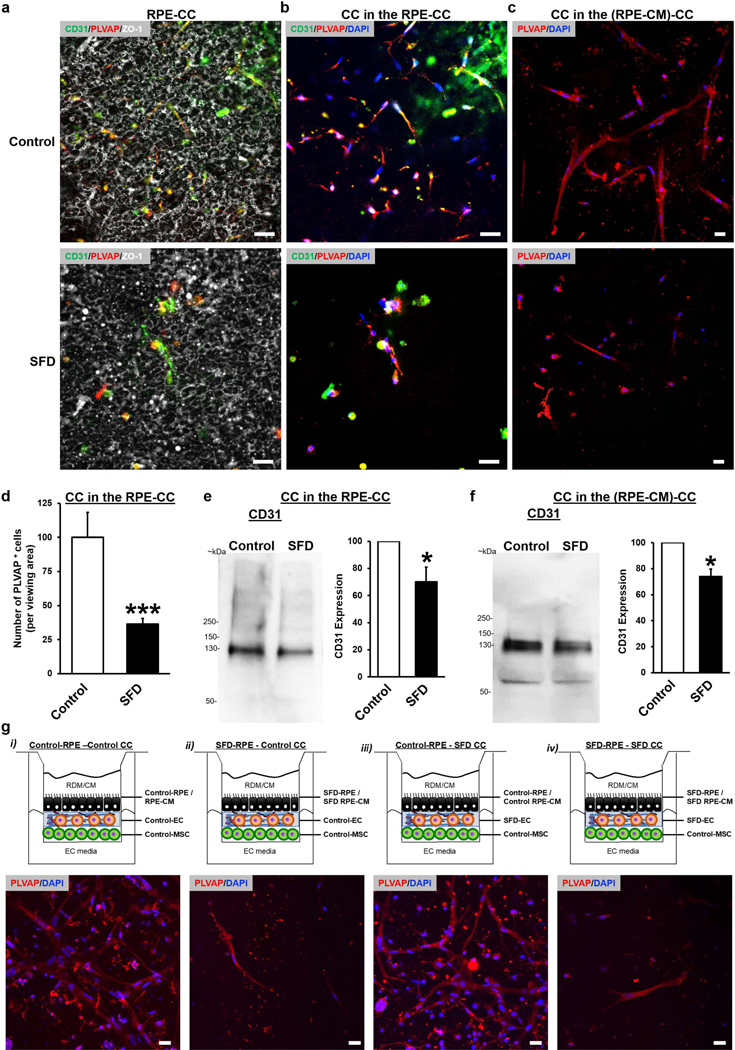
Figure 4. SFD RPE or RPE-CM disrupts CC vascular networks.
(a-c) Immunofluorescence images illustrating CD31 (green), PLVAP (red), ZO1 (gray), and DAPI (blue) expression for parallel cultures of (a, b) RPE-CC at day 30 or (c) (RPE-CM)-CC at day 14. RPE-CC samples were formed using iPSC-derived RPE and ECs from control patients (“Control”) or patients with Sorsby’s Fundus Dystrophy (“SFD”). (RPE-CM)-CC samples were treated with CM from control or SFD iPSC-RPEs. Scale bar = 20 μm.
(d) Quantitative analysis of the number (#) of PLVAP+ cells (normalized to control) in parallel cultures of control RPE-CC vs. SFD RPE-CC. n = 3 biological replicates. *** p ≤ 0.001. (e, f) Western blot images and quantitative analysis of relative CD31 protein (~130 kDa) levels for parallel cultures of (e) Control vs SFD RPE-CC and (f) Control vs SFD (RPE-CM)-CC. Total CD31 protein is shown normalized to the whole protein level in the lysate. n = 3 biological replicates. * p ≤ 0.05.
(g) Top panel: Schematic representation showing the configuration of (RPE-CM)-CC or RPE-CC where individual components were derived using iPSCs from Control or SFD patients. Bottom panel: Immunofluorescence images from ~day 14 RPE-CC cultures illustrating density of PLVAP+ vascular networks (red) for each individual cellular configuration (schematic shown above the image). DAPI shown in blue. Scale bar = 20 μm.

