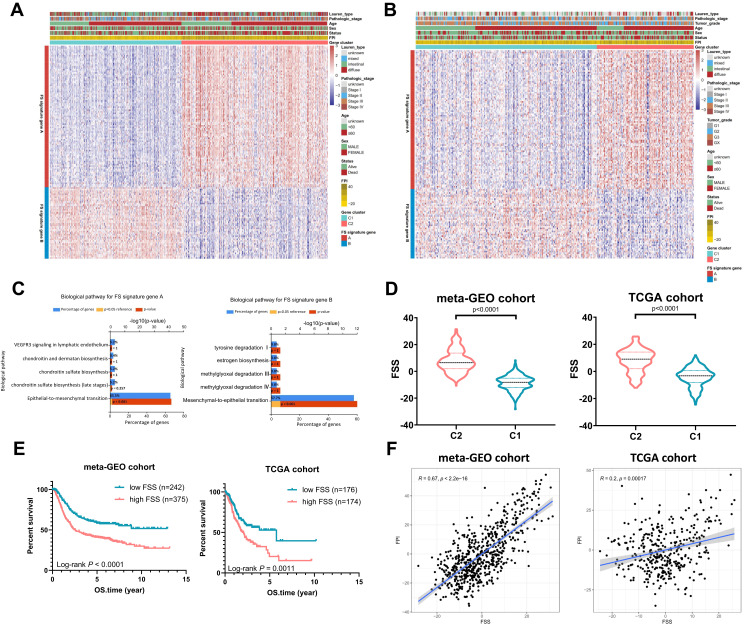
Figure 3.
Generation of FSS. (A) Heatmap of DEGs between C1 and C2 to assign patients in meta-GEO cohort into two subgroups: FS gene signature A and B. (B) Heatmap shows FS gene signatures obtained from the meta-GEO cohort can classify patients in TCGA cohort into C1 and C2. (C) Reactome enrichment analysis of the FS signature genes A and B. (D) The violin plots show FSS between C1 and C2. (E) Kaplan–Meier curves show OS for patients stratified by high FSS and low FSS. (F) Scatterplots exhibit the positive correlation between FPI and FSS.

