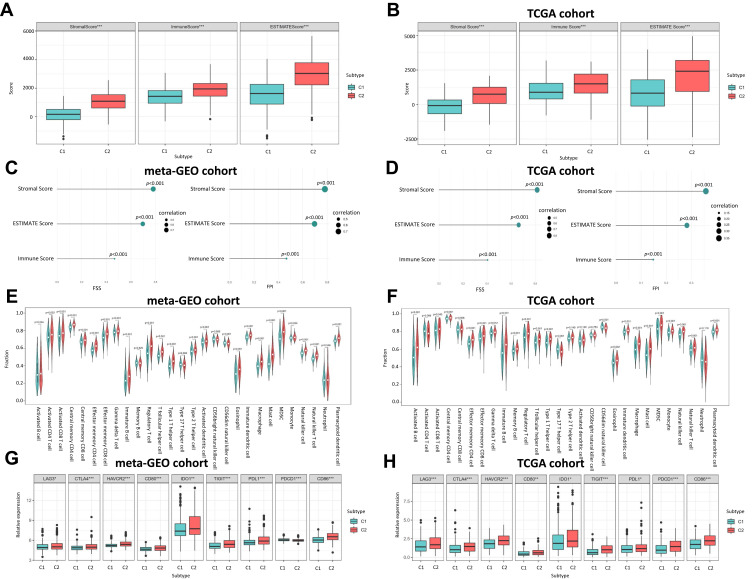
Figure 4.
The Correlation between Ferroptosis Subtypes and TME. (A) Boxplot shows the differences of immune score, stromal score and estimate score between C1 and C2 in meta-GEO cohort. (B) Boxplot shows the differences of immune score, stromal score and estimate score between C1 and C2 in TCGA cohort. (C) Correlation of FSS and FPI with the Immune score, stromal score and estimate score in meta-GEO cohort. (D) Correlation of FSS and FPI with the Immune score, stromal score and estimate score in TCGA cohort. (E) Violin plot shows the abundance of 21 immune cell populations distinguished by C1 and C2 in meta-GEO cohort. (F) Violin plot shows the abundance of 21 immune cell populations distinguished by C1 and C2 in TCGA cohort. The green box represents C1, red one represents C2. (G) Boxplot shows the expression levels of 9 immune checkpoint genes between C1 and C2 in meta-GEO cohort. (H) Boxplot shows the expression levels of 9 immune checkpoint genes between C1 and C2 in TCGA cohort. *p < 0.05; **p < 0.01; ***p < 0.001.

