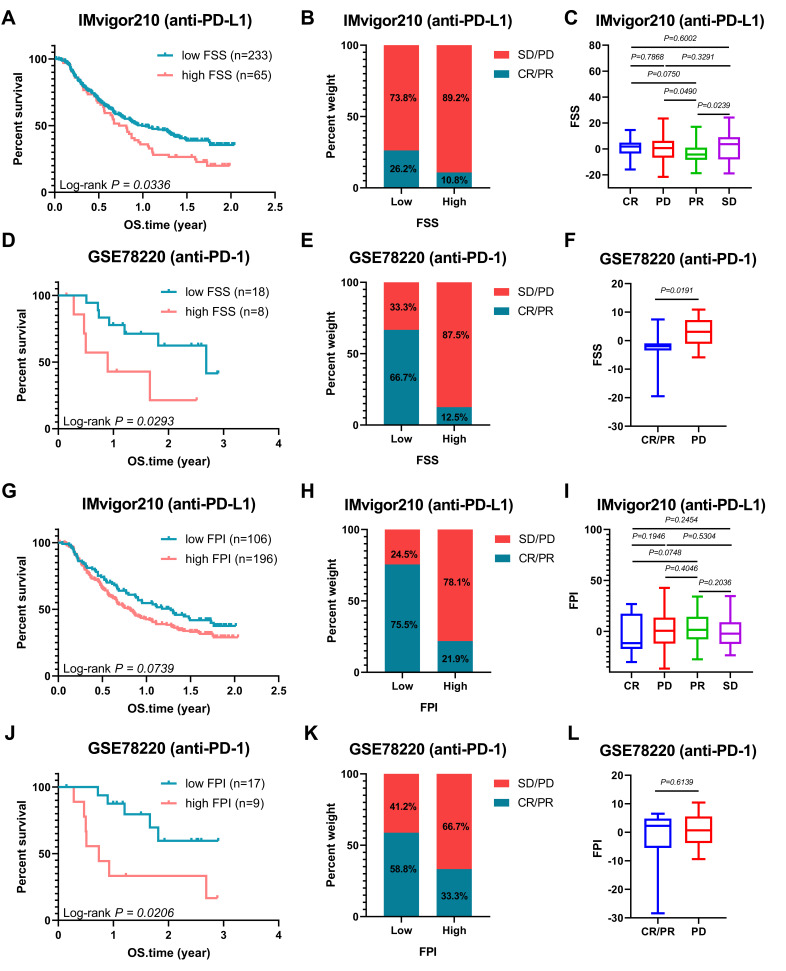
Figure 6.
Ferroptosis Patterns and Ferroptosis Potential Level in the Role of Anti-PD-1/L1 Immunotherapy. (A) Kaplan–Meier curves of low and high FSS patient groups in the anti-PD-L1 immunotherapy cohort (IMvigor210). (B) The proportion of patients with response to PD-L1 blockade immunotherapy in low or high FSS groups; SD: stable disease, PD: progressive disease; CR, complete response; PR, partial response. (C) Distribution of FSS in different anti-PD-L1 clinical response groups. (D) Kaplan–Meier curves of low and high FSS patient groups in the anti-PD-1 immunotherapy cohort (GSE78220). (E) The proportion of patients with response to anti-PD-1 immunotherapy in low or high FSS groups. (F) Differences in FSS among different anti-PD-1 clinical response groups. (G) Kaplan–Meier curves of low and high FPI patient groups in the anti-PD-L1 immunotherapy cohort (IMvigor210). (H) The proportion of patients with response to anti-PD-L1 immunotherapy in low or high FPI groups. (I) Distribution of FSS in different anti-PD-L1 clinical response groups. (J) Kaplan–Meier curves of low and high FPI patient groups in the anti-PD-1 immunotherapy cohort (GSE78220). (K) The proportion of patients with response to PD-1 blockade immunotherapy in low or high FPI groups. (L) Differences in FPI among different anti-PD-1 clinical response groups. The statistical significance of differences in all survival analysis was determined via the Log rank test.

