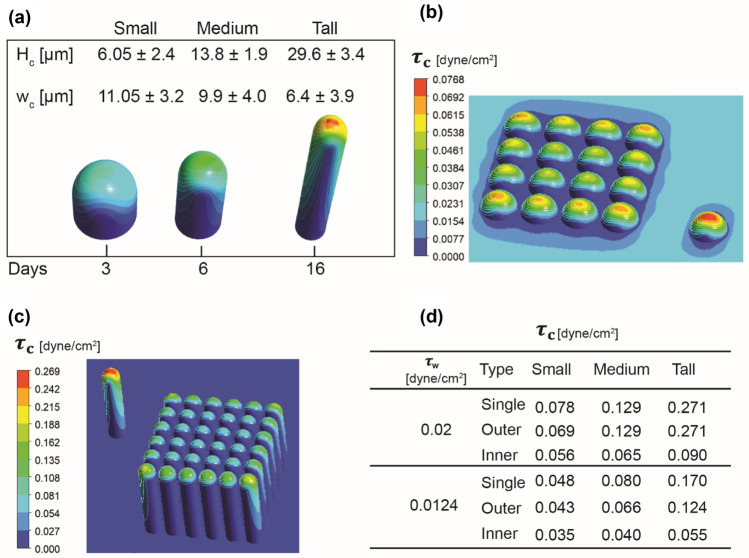
Fig. 2.
(a) Morphologies of cells, small, medium and tall, modelled in Ansys Fluent and based on real Caco-2 cells dimensions, representing typical dimensions respectively at day 3, 6 and 16 of cell growth and observed in standard cell culture (Hidalgo et al. 1989). Hc = cell height, wc = cell width, Days = days of culture. (b, c) Cell shear stress () as predicted by CFD simulations for (b) small and (c) tall cell morphologies in Ansys Fluent. (d) Summary of cell shear stress predictions from CFD simulations at = 0.02 dyne/cm2 corresponding to a flow rate of 29 µl/hr, and at = 0.0124 dyne/cm2 corresponding to a flow rate of 18 µl/hr

