FIGURE 5.

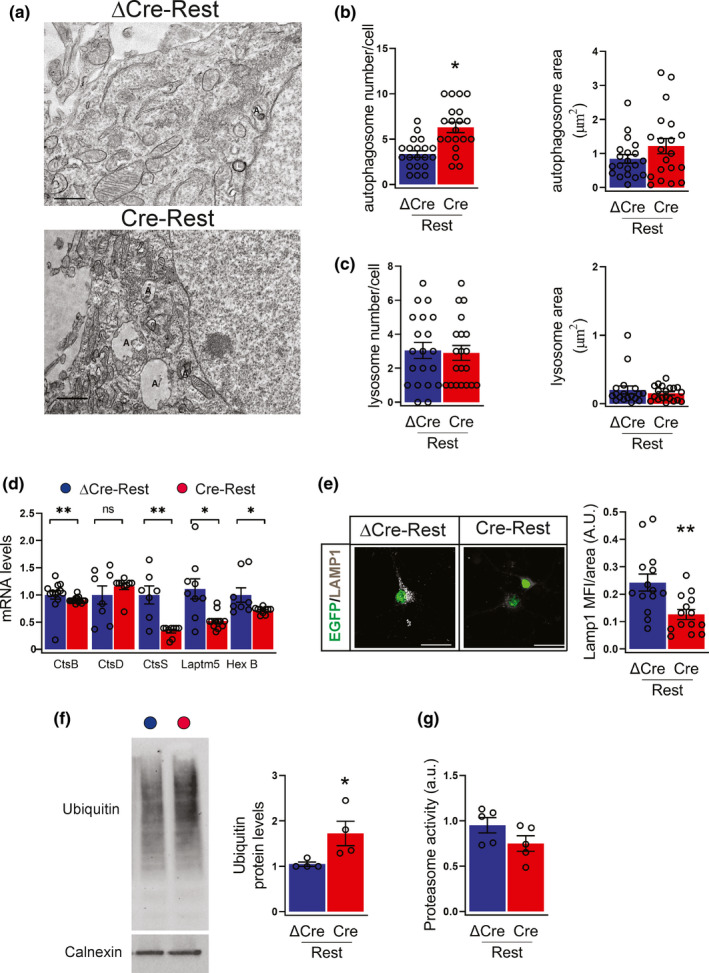
REST‐depleted neurons have an impaired autophagic flux (a) Representative micrographs of ΔCre‐ and Cre‐transduced neurons showing the presence of autophagosomes (indicated with an “A”) and lysosomes (marked with an “L”). Scale bar, 0.5 μm. (b,c) Quantification of the density (left) and area (right) of autophagosomes (b) and lysosomes (c) in ΔCre‐ (blue bars) and Cre‐(red bars) transduced neurons. n = 20 neurons from 3 independent preparations. (d) The mRNA levels of cathepsin B (CtsB), cathepsin D (CtsD), cathepsin S (CtsS), lysosomal‐associated protein transmembrane 5 (Laptm5), hexosaminidase subunit beta (HexB) were quantified by qRT‐PCR in ΔCre‐ and Cre‐transduced neurons. Gapdh, Actin, and GusB were used as control housekeeping genes. n = 8–15 replicates from 4 independent preparations. (e) Representative images (left) and quantification (right) of ΔCre‐ and Cre‐transduced neurons stained for Lamp1 (white). Transduced neurons are EGFP tagged. n = 14 coverslips from 4 independent preparations. Scale bars, 20 μm. (f) Representative western blot (left) and quantification (right) of protein ubiquitination in ΔCre‐ and Cre‐transduced neurons. Ubiquitinated proteins were detected with anti‐ubiquitin antibody, using calnexin as loading control. n = 4 independent preparations. (g) Proteasome activity in ΔCre‐ and Cre‐transduced neurons. n = 4 independent preparations. Graphs show means ± sem. *p < 0.05; **p < 0.01; unpaired two‐tailed Student's t test for (b,e,f) and Mann–Whitney U‐test for (d)
