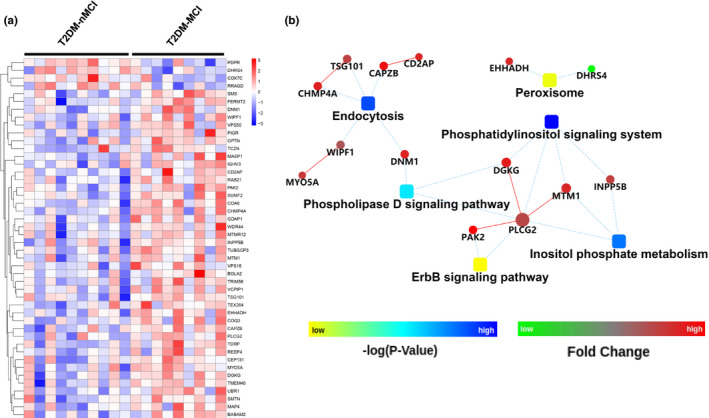
FIGURE 1.

Differentially expressed proteins (DEPs) and protein‐protein interaction (PPI) networks in T2DM‐MCI vs T2DM‐nMCI. (a) 46 DEPs were identified in the platelet of T2DM‐MCI patients compared with the T2DM‐nMCI (p < 0.05, increased proteins: red; decreased proteins: blue). (b) The PPI networks indicate the interactions of DEPs with each other in T2DM‐MCI vs T2DM‐nMCI, and endocytosis, peroxidase, ErbB, and phosphatidylinositol signaling system are closely associated
