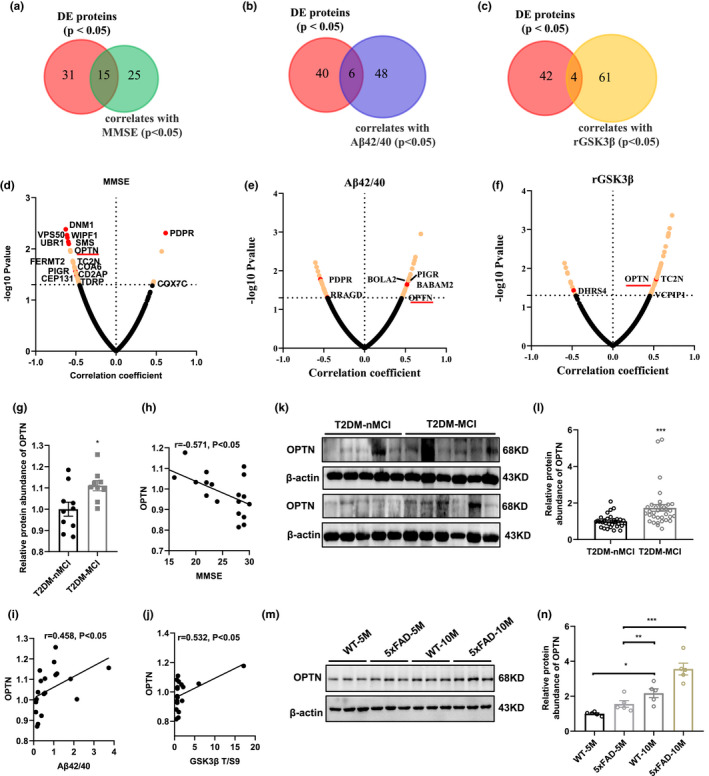
FIGURE 5.

Elevated platelet OPTN can discriminate T2DM‐MCI from T2DM‐nMCI. (a‐c) Overlap of proteins significantly different in T2DM‐MCI vs. T2DM‐nMCI with proteins correlated to MMSE, Aβ1‐42/Aβ1‐40, and rGSK‐3β (p < 0.05). (d‐f) Correlation of proteins with MMSE (d), Aβ1‐42/Aβ1‐40 (e), and rGSK3β (f). Proteins with corresponding p values <0.05 are labeled in yellow. Overlap of proteins have been marked in red dot. OPTN is the only protein correlated with MMSE, Aβ1‐42/Aβ1‐40, and rGSK‐3β. (g) Dot plots represent the relative expression level of OPTN in different samples (p < 0.05). (h‐j) Correlation of OPTN with MMSE (h; r = −0.571, p = 0.011), Aβ1‐42/Aβ1‐40 (i; r = 0.458, p = 0.049), and rGSK‐3β (j; r = 0.532, p = 0.019). (k, l) Relative levels of platelet OPTN in T2DM‐MCI compared to T2DM‐nMCI. Data were shown as mean ±SEM. ***p < 0.001; T2DM‐nMCI: n = 30; T2DM‐MCI: n = 34. (m, n) Relative levels of hippocampal OPTN in 5‐ and 10‐month old 5xFAD mice compared to age‐matched WT mice. Data were shown as mean ±SEM. *p < 0.05, **p < 0.01 and ***p < 0.001, n = 5
