
FIGURE 2.
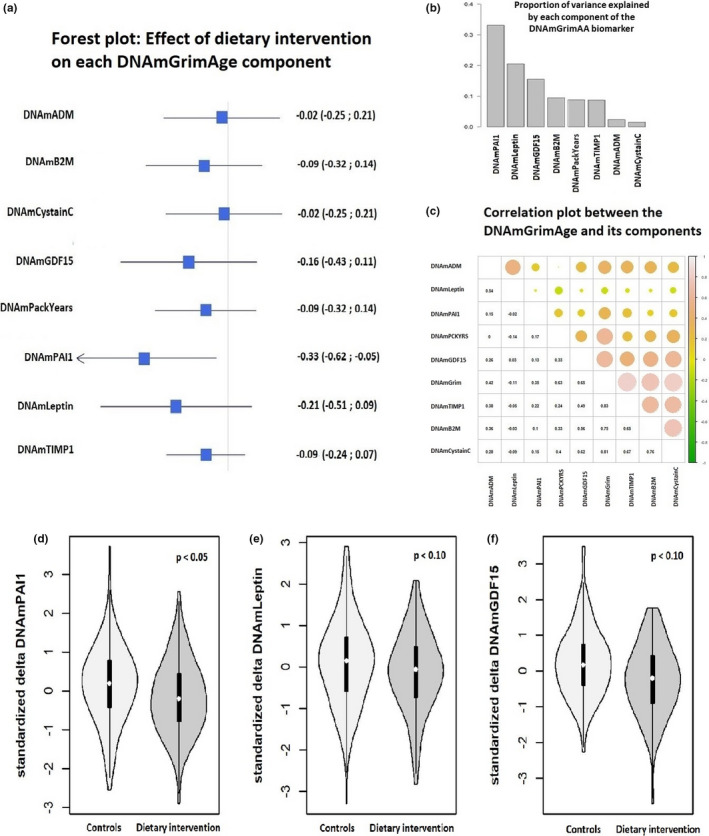
Analysis of the eight components of the DNAmGrimAge: a. Forest plot indicating the effect of the dietary intervention on each component of the DNAmGrimAge (expressed as standard deviations change to be comparable among them). b. Proportion of variability explained by each component of the DNAmGrimAge. c. Correlation matrix among DNAmGrimAge and its components. d‐e‐f. Violin plots. Distribution of the standardized delta DNAmPAI1, delta DNAmLeptin, and delta DNAmGDF15 (measure after two‐year trial minus measure at baseline) in women participating in the dietary intervention vs. control group