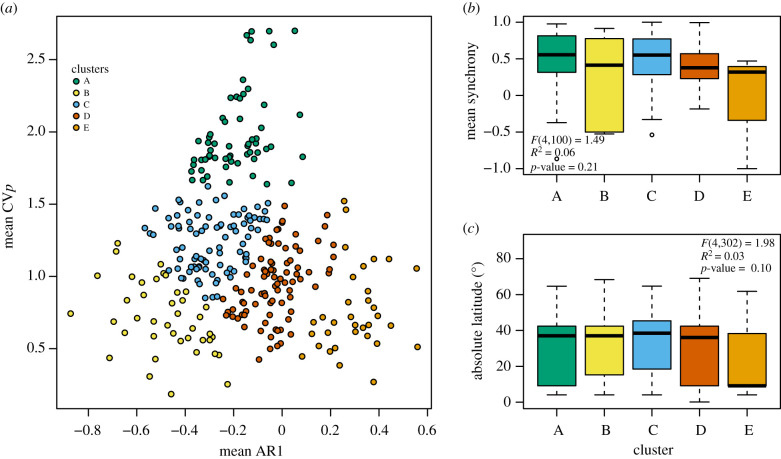
Figure 2.
Different reproductive strategies across the plant ToL. (a) Species cluster into five groups based on their population-level coefficient of variation (CVp) and lag-1 autocorrelation (AR1). Metrics were averaged across replicate time series for 307 species. Clusters did not vary in mean (b) spatial synchrony globally and (c) absolute latitude. PGLS models testing the effect of clusters are shown inset for (b) and (c). (Online version in colour.)

