Figure 4.

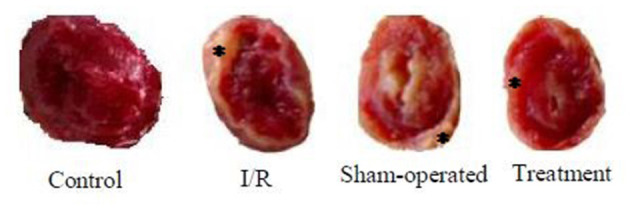
The representative images of the infarct size data were taken from control, I/R, sham-operated, and treatment groups. * denotes the myocardial scar. I/R, ischemia/reperfusion.

The representative images of the infarct size data were taken from control, I/R, sham-operated, and treatment groups. * denotes the myocardial scar. I/R, ischemia/reperfusion.