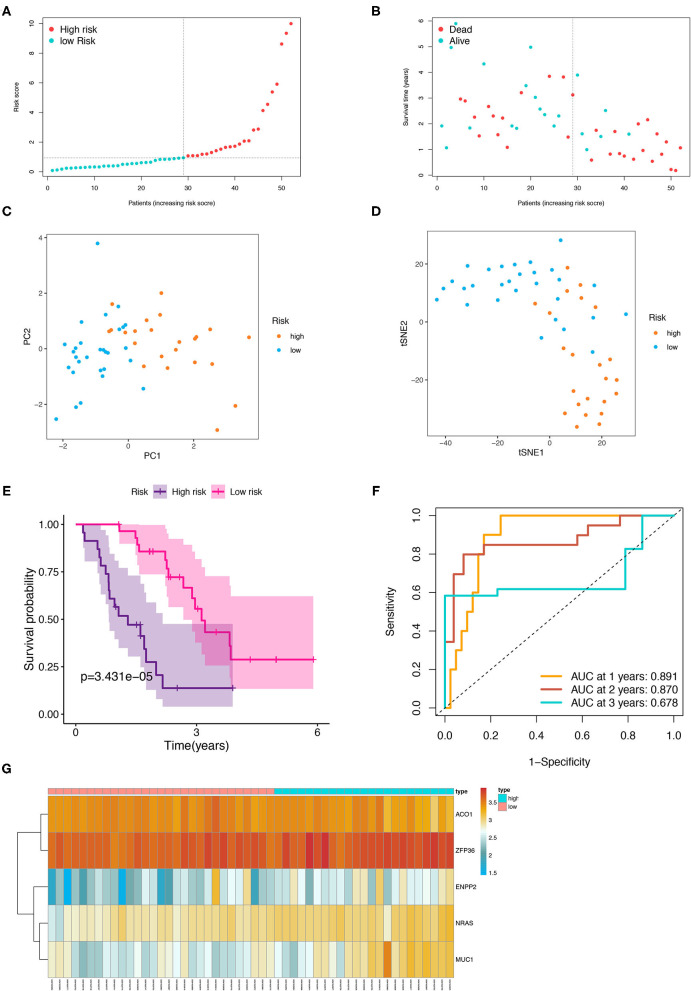
Figure 6.
Internal validation of the five-FRGs signature. Distribution of IPF samples (A) and OS status (B) based on the median value of the risk scores. PCA (C) and t-SNE (D) analysis of the testing group. Kaplan–Meier survival (E) and time-dependent ROC curve (F) analysis of the five-FRGs signature in the testing group. (G) Heatmap of the expression profiles of the five-FRGs in low- and high-risk groups of the testing cohort. FRGs, ferroptosis-related genes; IPF, idiopathic pulmonary fibrosis; OS, overall survival; PCA, principal component analysis; t-SNE, t-distributed stochastic neighbor embedding; ROC, receiver operating characteristic.

