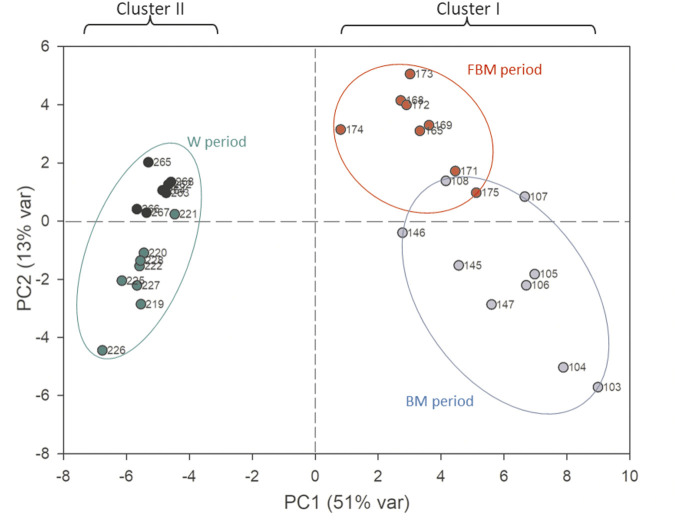
FIGURE 3.
PCA scores plot performed on the metabolomic dataset of stool samples. The first principal component (PC1) accounts for the 51% of the overall variance, while the second (PC2) accounts for the 13%. Blue dots: 103–147 days; red dots: 165–175 days; green dots: 219–228 days; black dots: 262–268 days.

