FIGURE 4.
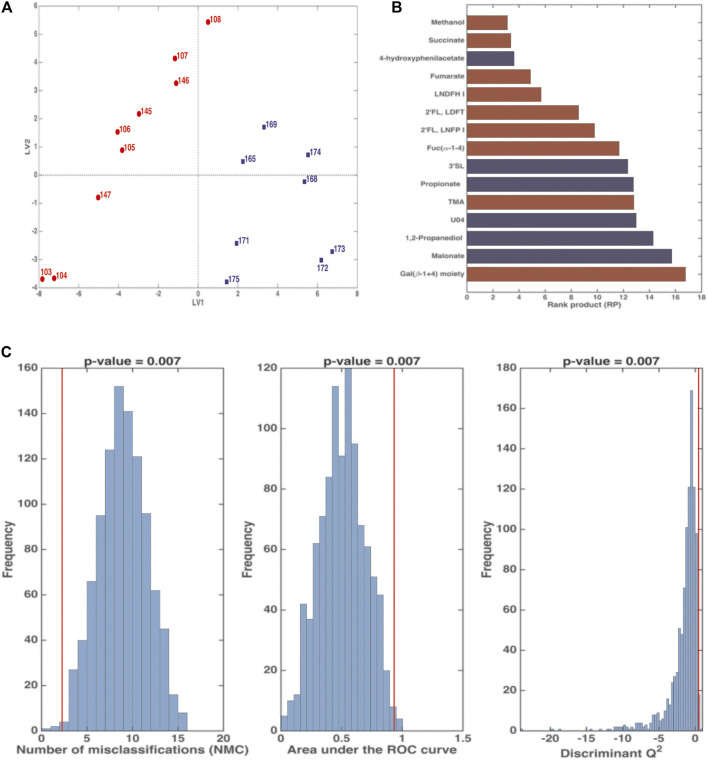
PLS-DA analysis in Double Cross Validation (DCV) of stool samples on BM (red) and FBM (blue) periods. Panel (A) reports latent variables (LV) scores plot. Panel (B) reports the variables that significantly contributes to the PLS-DA model by means of the rank product (RP). The criterion RP <average RP was used to identify the potential markers, that are the ones displayed as bar plot in the panel. Red variables were higher in the BM period; blue variables were higher in the FBM period. Panel (C) reports the validation of the PLS-DA model. The figures of merit namely Number of Misclassifications (NMC), Area Under the Receiver Operating Characteristic curve (AUROC) and Discriminant Q2 (DQ2), calculated on the outer cross-validation loop (red vertical bars) were compared to their respective distribution under the null hypothesis (estimated by means of permutation test), indicating that the discrimination observed is statistically significant.

