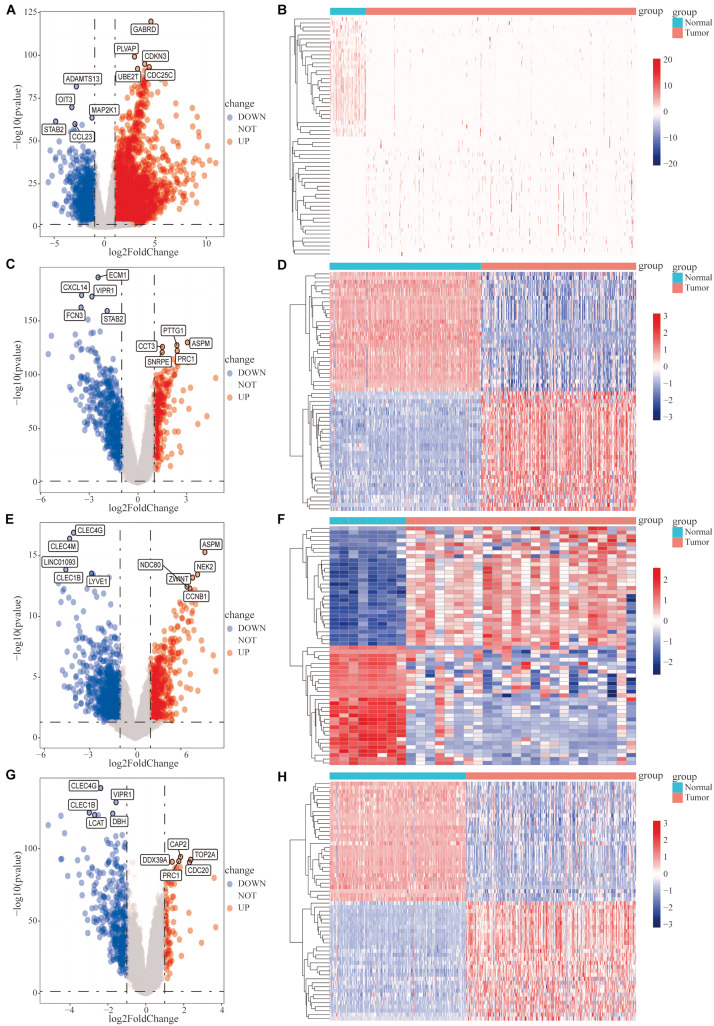
FIGURE 1.
Analysis of differentially expressed genes (DEGs) between hepatocellular carcinoma (HCC) tumor tissues and adjacent normal tissues. Differential expression analysis was performed, based on the gene expression data for HCC patients, and the analysis results are presented as volcano plots and heat maps. (A,B) The cancer genome atlas (TCGA)-HCC dataset, (C,D) GSE14520 dataset, (E,F) GSE101685 dataset, and (G,H) GSE36376 dataset.

