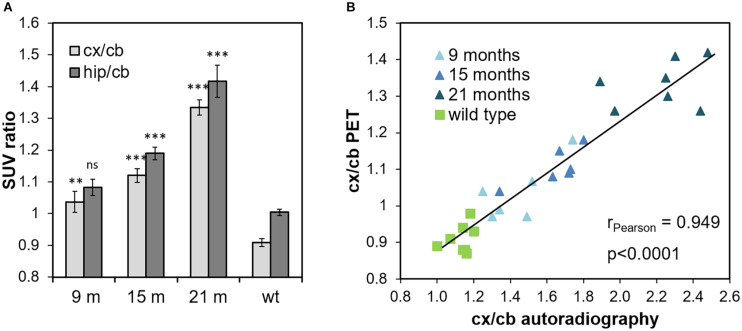
FIGURE 2.
Quantification of FBB retention measured by PET and ex vivo autoradiography. (A) In vivo tracer retention was quantified in cortical and hippocampal VOIs with cerebellum as reference region and expressed as cortex-to-cerebellum (cx/cb) and hippocampus-to-cerebellum ratios (hip/cb), respectively. Data are expressed as mean ± SEM; ns, not significant, **p < 0.001, ***p < 0.0001 vs. wild-type (wt). (B) Volumetric quantification of cortex-to-cerebellum ratios (cx/cb) as measured by PET and autoradiography in the very same animal, respectively, are plotted against each other (linear regression line, R2 = 0.9). Each symbol represents one ARTE10 mouse of the respective age groups (triangle) or a wild-type mouse (square).

