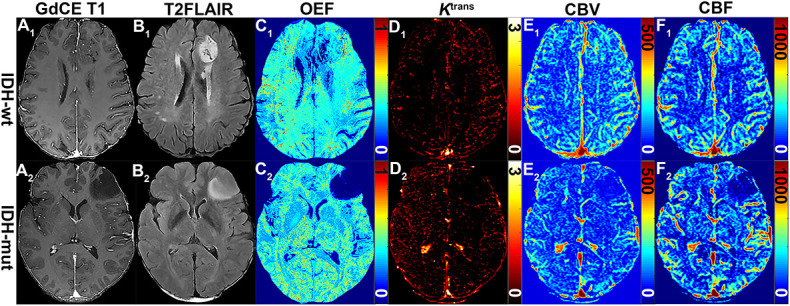
FIGURE 1.

MRI-based OEF and DCE perfusion images in representative glioma patients with and without IDH mutation. Two exemplary patients with IDH1-wt (astrocytoma II; A1–F1) and IDH1-mut (astrocytoma II; A2–F2) lower-grade glioma shown: (A1) gadolinium contrast-enhanced (GdCE) 3DT1BRAVO, (B1) T2-FLAIR, (C1) QQ-based OEF maps by CAT, DCE-MRI with separated Ktrans (D1), CBV (E1), and CBF (F1) maps. OEF map (C1) allows to delineate significantly inhomogeneous hyperintensity in the contrast-enhanced region of the IDH1 wild-type astrocytoma; DCE-derived maps (D1–F1) clearly show the area of hyperperfusion and high permeability in the IDH1 wild-type astrocytoma.
