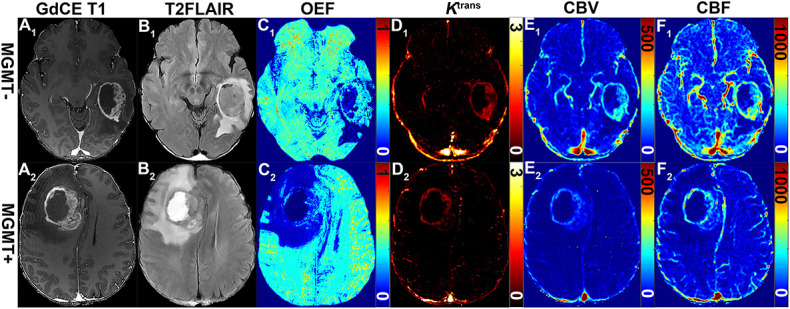
FIGURE 2.

Representative MRI-based OEF and DCE perfusion images of glioma patients with and without methylated MGMT promoter. Two GBM patients with unmethylated (51-year-old woman with MGMT–: A1–F1) and methylated (58-year-old man MGMT+: A2–F2) promoter shown: (A1) GDCE 3D T1BRAVO, (B1) T2-FLAIR, (C1) QQ-based OEF maps with CAT, DCE-MRI with separated Ktrans (D1), CBV (E1), and CBF (F1) maps. OEF map (C1) allows to identify a focal area of higher values within the lesion for patients with unmethylated MGMT promoter; DCE-derived maps (D1–F1) show a tendency toward higher signal intensities.
