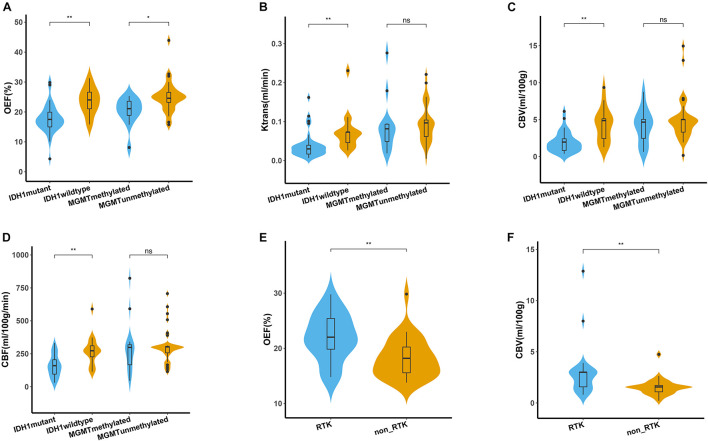
FIGURE 3.
Quantitative comparison of oxygen metabolism and vascular metrics of genetic profiles. (A–D) Comparison of OEF, Ktrans, CBV, and CBF measurements between IDH1 mutant and wild type in lower-grade glioma (left panel), as well as between MGMT methylated and unmethylated glioblastoma (right panel). Comparison of OEF (E) and CBV (F) values between RTK and non-RTK subgroup. The violin plot marked with asterisk (*) indicates that the values were significantly different between the groups (*P < 0.05; **P < 0.01).

