FIGURE 5.
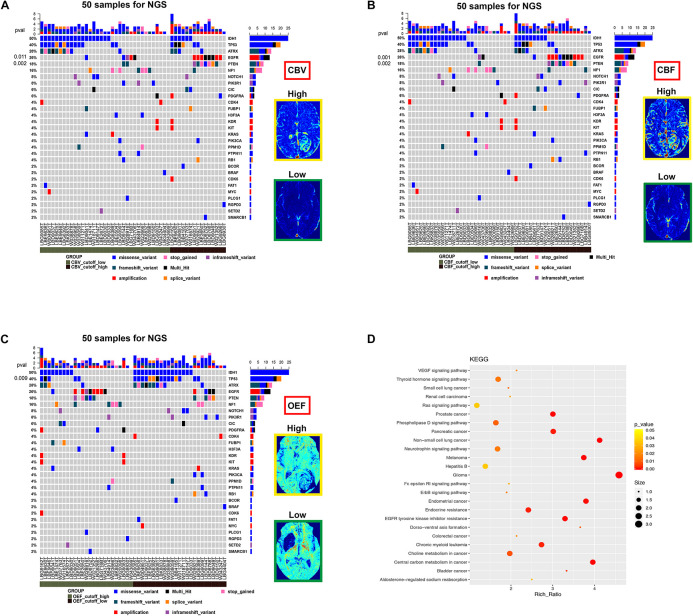
The mutational landscape and biological signatures for 50 tumor samples with NGS, 49 of which harbored genetic alterations. (A–C) Samples from patients have been stratified according to the cutoff value of imaging parameters (CBV, CBF, and OEF) for RTK aberrations. The heat map below displays the somatic mutated genes ordered by their respective mutation frequencies. The significant genes with a p-value < 0.05 were labeled on the left. (D) Kyoto Encyclopedia of Genes and Genomes pathway analysis enriched in the RTK subgroup.

