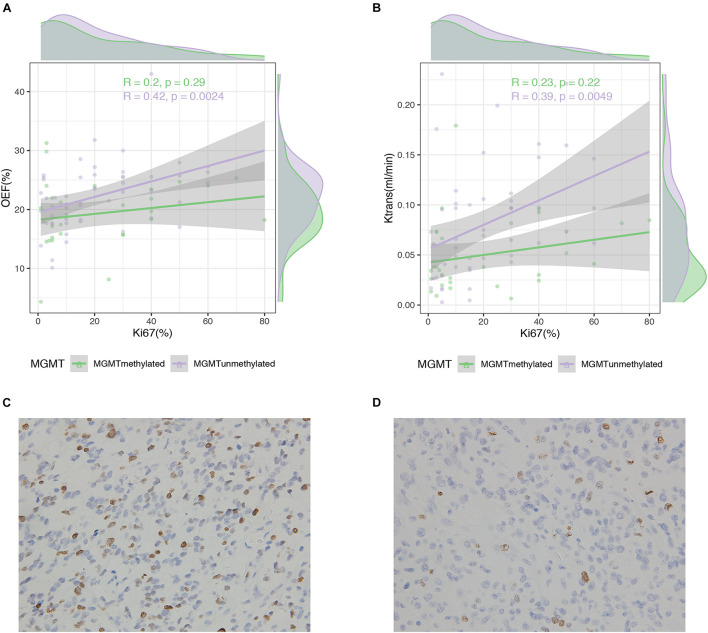
FIGURE 6.
Correlation between MRI measures and Ki67 expression in glioma patients. Scatterplot with linear regression line shows a weak to moderate association between MRI measures of OEF (A) and Ktrans (B) with Ki67 expression in MGMT promoter methylated and unmethylated gliomas followed by Ki-67 immunohistochemistry on the lower panel (C,D).

