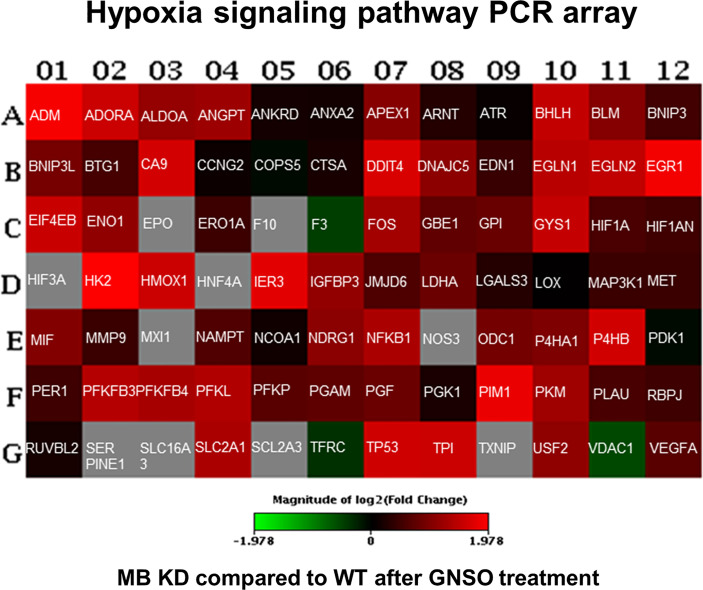
Figure 5.
Human hypoxia signaling pathway analysis. WT and KD MDA-MB-468 cells were treated with 500 µM GNSO for 3 h to stimulate HIF-1α accumulation. Changes in expression of 84 genes related to hypoxic signaling were analyzed between KD and WT cells using the RT² Profiler™ PCR Array Human Hypoxia Signaling Pathway (Qiagen). After MB knockdown, most of the genes involved in hypoxic signaling showed an increased expression compared to WT cells. Changes are represented in a heat-map format giving the log 2 fold changes with green = underexpression in KD cells compared to WT cells, red = overexpression in KD cells compared to WT cells and grey = not analyzable. The exact fold change values are depicted in Supplementary Table 1 .

