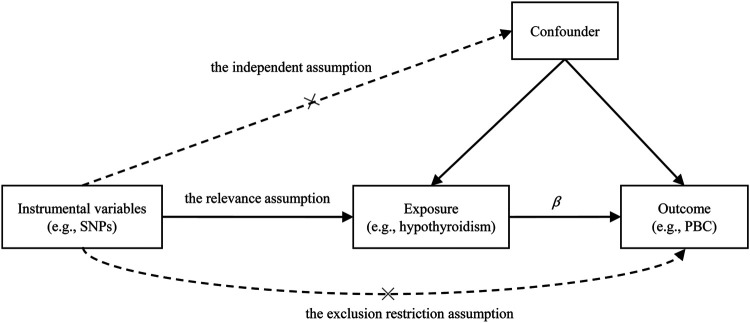
FIGURE 2.
Illustrative diagram for the Mendelian randomization (MR) framework. MR analysis aims to estimate the causal effect of an exposure on the outcome (β) in observational studies. The plot displays the three assumptions for instrumental variable commonly required in MR analysis. Dotted lines represent possible ways that the assumptions could be violated. PBC, primary biliary cirrhosis; SNP, single nucleotide polymorphism.

