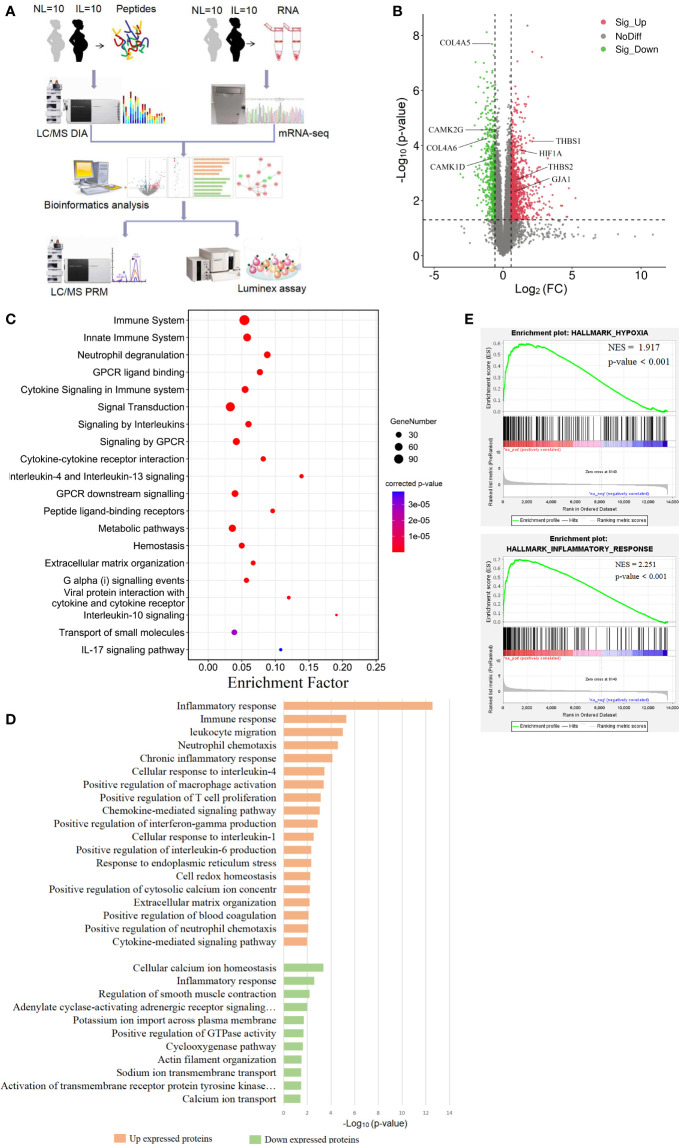
Figure 1.
Visualization of the transcriptomics results of mRNAs between nonlabor and in labor myometrium. (A) Overall study design and workflow. (B) Volcano plot of all mRNA alteration between NL and IL groups. The horizontal dashed line corresponds to p value < 0.05, and the vertical dashed line corresponds to a 1.5-fold change decrease or increase in expression levels. Red, green, and black dots represent upregulated, downregulated, and nondifferentially expressed transcripts in the IL group (as compared to the NL group), respectively. Data associated with this figure can be found in Supplemental Table 1 . (C) Bubble diagram of partial significantly enriched pathways for DE mRNAs. (D) Bar diagram of partial biology progress GO term clusters of DE mRNAs. (E) GSEA plots of mRNA sets of hypoxia and inflammatory response.

