FIGURE 4.
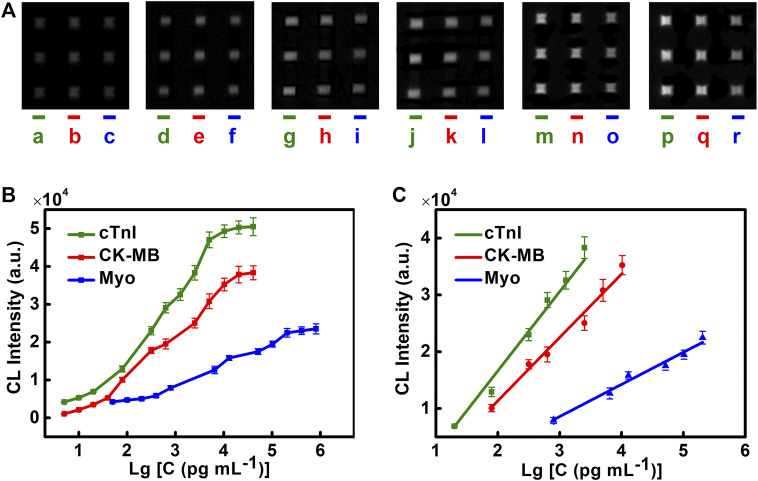
Performance of the microfluidic chemiluminescence immunoassay for simultaneous detection of cTnI, CK-MB, and Myo. (A) CL images of cTnI (left), CK-MB (middle), and Myo (right) in each chip at different concentrations. The concentrations of cTnI from left to right are 20, 80, 320, 640, 1,280, and 2,560 pg/ml (lines a, d, g, j, m, and p). The concentrations of CK-MB from left to right are 0.08, 0.32, 0.64, 2.56, 5.12, and 10.24 ng/ml (lines b, e, h, k, n, and q). The concentrations of Myo from left to right are 0.8, 6.4, 12.8, 51.2, 102.4, and 204.8 ng/ml (lines c, f, i, l, o, and r). (B) Detection curves of cTnI, CK-MB, and Myo. (C) Linear range for cTnI, CK-MB, and Myo. The error bar indicates the standard deviation of the CL signals from nine spots in one microfluidic chip.

