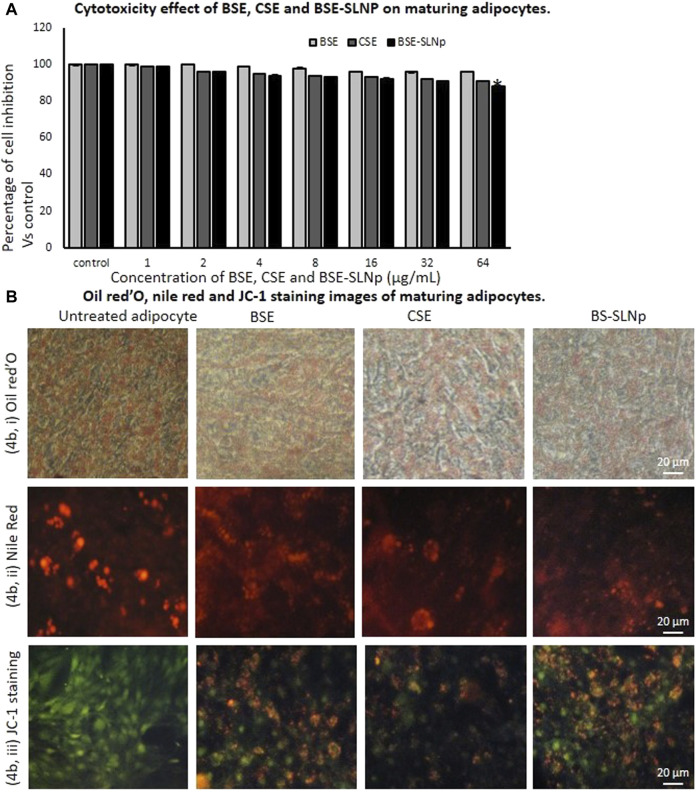
FIGURE 4.
In vitro cytotoxicity after 48 h (4A), Oil Red O (4Bi), Nile red (4Bii), and JC-1 (4Biii) stained microscopic image analysis of vehicle control, BSE, CSE, and BSE-SLNp treated maturing adipocyte after 14 days. Each value is means ± SD (n = 6). *p ≤ 0.05 by comparison with vehicle control. In Oil Red O staining and Nile red staining, vehicle control showing hypertrophic adipocyte directly propositional to triglyceride storage. But in BSE-SLNp treatment shown controlled adipocyte maturation, less lipid accumulation, and less florescent staining. BSE-SLNp treated cells showing the highest reduction compared to BSE or CSE. JC-1 fluorescence images showing merged images of the red and green signals of the dye, corresponding to JC-1 in J-aggregates vs. monomeric form. We found less J-aggregates and hypertrophic adipocyte in vehicle control. In BSE-SLNp treated adipocyte showing high J-aggregates directly representing active mitochondria (high MMP, Δψm).

