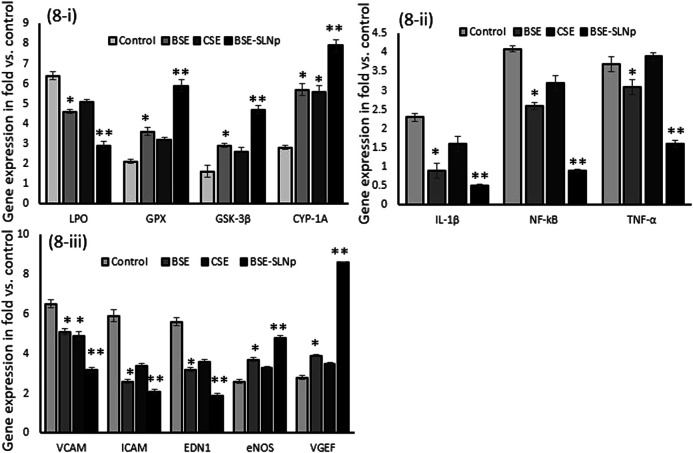
FIGURE 8.
Effect of BSE, CSE, and BSE-SLNp on oxidative stress and antioxidant (8i), proinflammatory (8ii), and vascular cell inflammation (8iii) related gene expression levels in H2O2 induced oxidative stressed HUVECs after 48 h. Each value is means ± SD (n = 6). *p ≤ 0.05 by comparison with vehicle control. **p ≤ 0.001 by comparison with vehicle control, BSE, and CSE.

