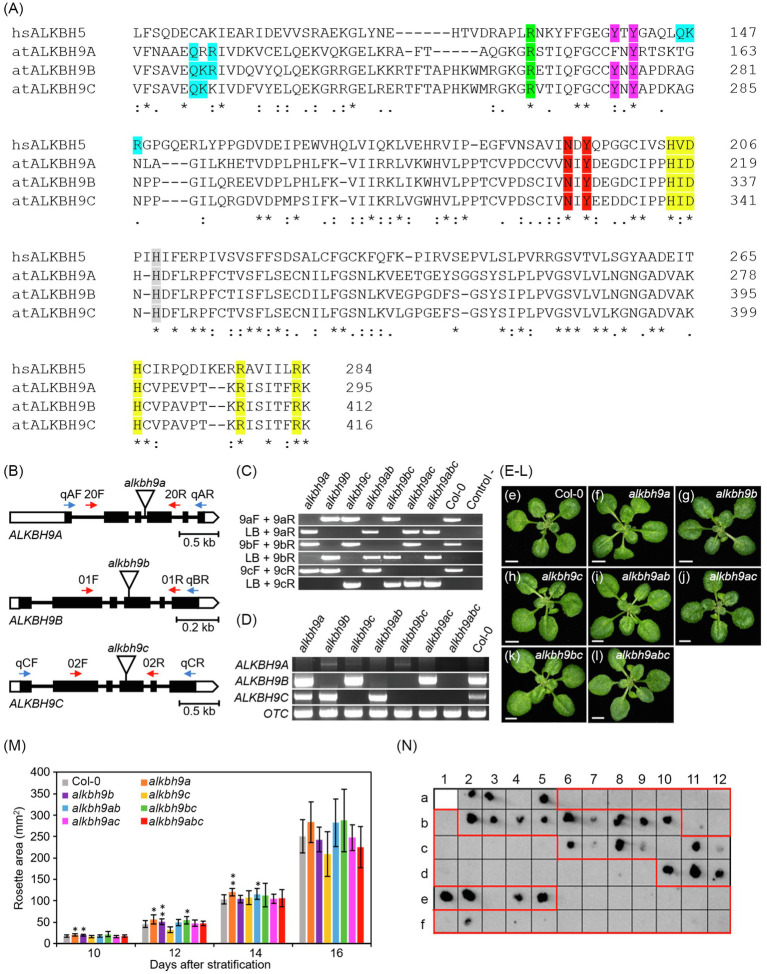
Figure 1.
ALKBH9A and ALKBH9C are not involved in AMV systemic infection. (A) Multiple alignment of the amino acid sequences of the AlkB domain from ALKBH9 Arabidopsis paralogs and human ALKBH5. Protein sequences were obtained from the Arabidopsis Information Resource (https://www.arabidopsis.org/). The alignment was obtained with Clustal Omega 1.2.4 with default settings. Asterisks and periods in the consensus line indicate identical and similar residues, respectively. Numbers indicate residue positions. Residues/motifs involved in binding or interactions stabilization in hsALKB5 are highlighted in different colors (see main text). at, Arabidopsis thaliana; hs, Homo sapiens. (B) Schematic representation of the structure of the ALKBH9A, ALKBH9B, and ALKBH9C genes, with indication of the positions of the T-DNA insertions carried by the alkbh9a, alkbh9b, and alkbh9c mutants. Boxes and lines between boxes represent exons and introns, respectively. Open and black boxes represent untranslated and coding regions, respectively. Triangles represent T-DNA insertions. The oligonucleotides (not drawn to scale) used as RT-PCR and PCR primers are represented as horizontal blue and red arrows, respectively. The following abbreviations are used for oligonucleotide names throughout this figure: LB for LbB1.3; 20F/R for SALK_204823C_F/R; 01F/R for SALK_015591_F/R; 02F/R for SALK_021775_F/R; Lb for LbB1.3a; 9aF/R for qALKBH9a_F/R; 9bF/R for qALKBH9b_Rb; and 9cF/R for qALKBH9c_F/R (see Supplementary Figure Legends). (C) Genotyping of the insertional single and multiple alkbh9 mutants studied in this work. The presence of the T-DNA insertions shown in (B) was visualized by agarose gel electrophoresis of the PCR amplification products obtained using the primer pairs indicated, one of which is specific to the T-DNA (LB in the figure) and the remaining ones of the disrupted genes. For simplicity, the following non-standard abbreviations are used for genotypes throughout this figure: alkbh9ab for the alkbh9a alkbh9b double mutant; alkbh9ac for alkbh9a alkbh9c; alkbh9bc for alkbh9b alkbh9c; and alkbh9abc for the alkbh9a alkbh9b alkbh9c triple mutant. (D) Visualization by agarose gel electrophoresis of the semiquantitative RT-PCR amplification products obtained from ALKBH9A, ALKBH9B, ALKBH9C, and OTC mRNAs. RNA was extracted from plants of the genotypes indicated, some of which are abbreviated as mentioned above. The primers used are also abbreviated as mentioned above. (E–L) Rosettes of (e) the Col-0 WT, the (f) alkbh9a, (g) alkbh9b, and (h) alkbh9c single mutants, the (i) alkbh9a alkbh9b, (j) alkbh9a alkbh9c, and (k) alkbh9b alkbh9c double mutants, and (l) the alkbh9a alkbh9b alkbh9c triple mutant. Photographs were taken 14days after stratification (das). Scale bars indicate 2mm. (M) Rosette growth progression of the alkbh9 single and multiple mutants studied in this work. Rosette area was measured for the genotypes indicated at 10, 12, 14, and 16days after stratification (das). Twelve rosettes were measured per genotype. Asterisks indicate values significantly different from WT (Col-0) in a Student t test (n=12; *p<0.05, **p<0.001). Error bars indicate standard deviation. (N) Tissue printing of floral stems from infected plants: WT (a2-a5), alkbh9b (a6-b1 and b11-c5), alkbh9a (b2-b10), alkbh9c (c6-c12), alkbh9ab (d1-d9), alkbh9ac (d10-e5), alkbh9bc (e6-f3), and alkbh9abc (f4-f12) plants.

