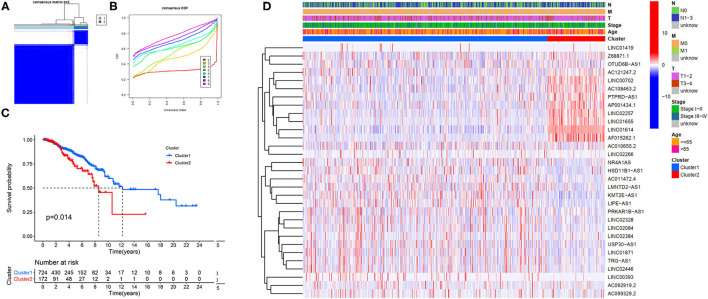
Figure 4.
Hierarchical consensus clustering based on the prognostic FRLncRNAs. (A) Consensus clustering analysis identification of two clusters (n = 896); (B) Cumulative distribution function (CDF) for k = 2–9; (C) Kaplan–Meier (K–M) curves for the 896 patients breast cancer (BC) stratified by cluster; (D) Heatmap on the prognostic FRLncRNAs ordered by clusters. The association with clusters, survival probability, and clinical information (age, stage, T stage, N stage, and M stage) were investigated.

