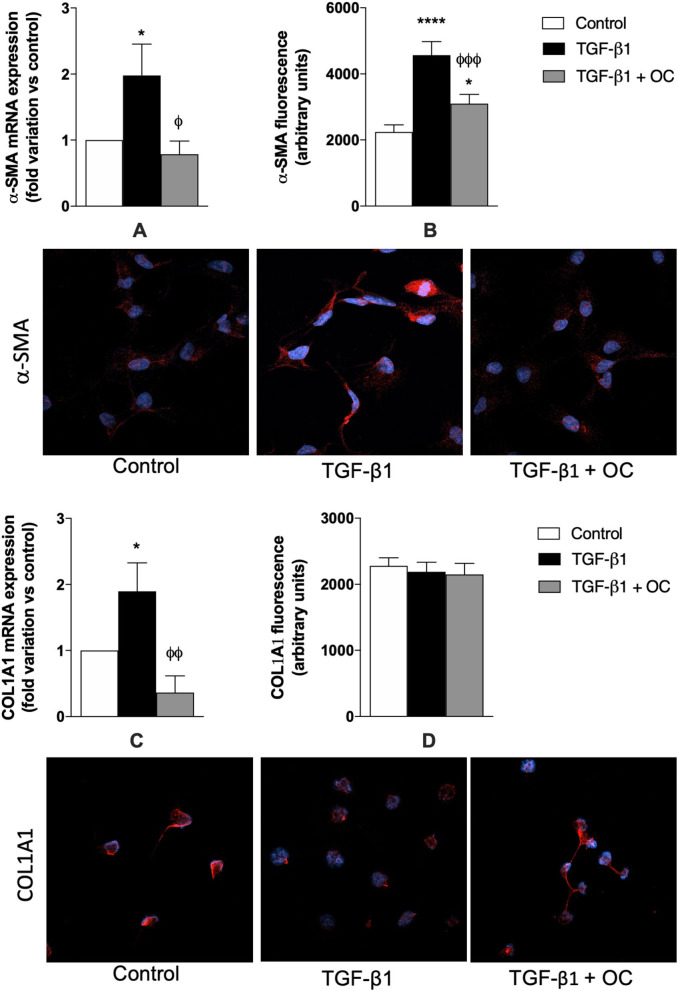
Figure 2.
Effect of OC on α-SMA (A, B) and COL1A1 (C, D) mRNA and protein expression in LX2 cell line. *P < 0.05, ****P < 0.0001 vs. control, ϕP < 0.05, ϕϕP < 0.01, ϕϕϕP < 0.001 vs. TGF-β1 treated cells. Representative images of α-SMA and COL1A1-related red fluorescence are shown. Cell nuclei are stained blue with DAPI. At least 8 fields per coverslip have been analyzed to obtain the quantification of fluorescence. Results are the mean of 3 independent experiments and have been analyzed by one-way ANOVA followed by the Tukey's post hoc test.

