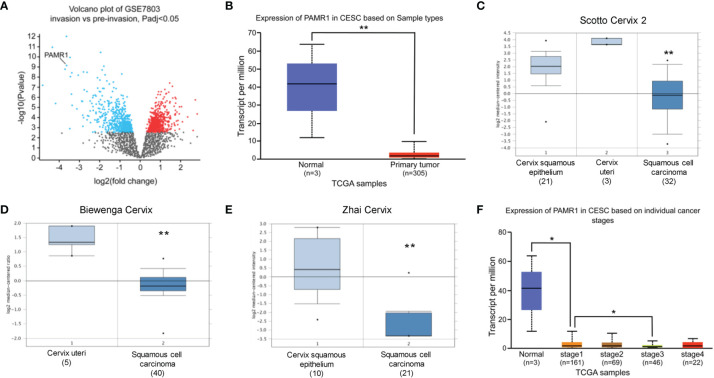
Figure 1.
The expression of PAMR1 in cervical cancer. (A) Volcano plot of the distribution of differentially expressed genes (DEGs) in GSE7803: blue dots represent downregulated DEGs, whereas red dots are upregulated DEGs in invasive cervical squamous cell carcinomas. PAMR1 gene was indicated. (B) The expression of PAMR1 in TCGA-CESC from the UALCAN database. (C–E) The expression of PAMR1 between CECC and normal cervix uteri tissue in three GEO datasets from the Oncomine™ database. (F) The expression of PAMR1 in TCGA-CESC based on individual cancer stage in the UALCAN database. *p < 0.05, **p < 0.01.

