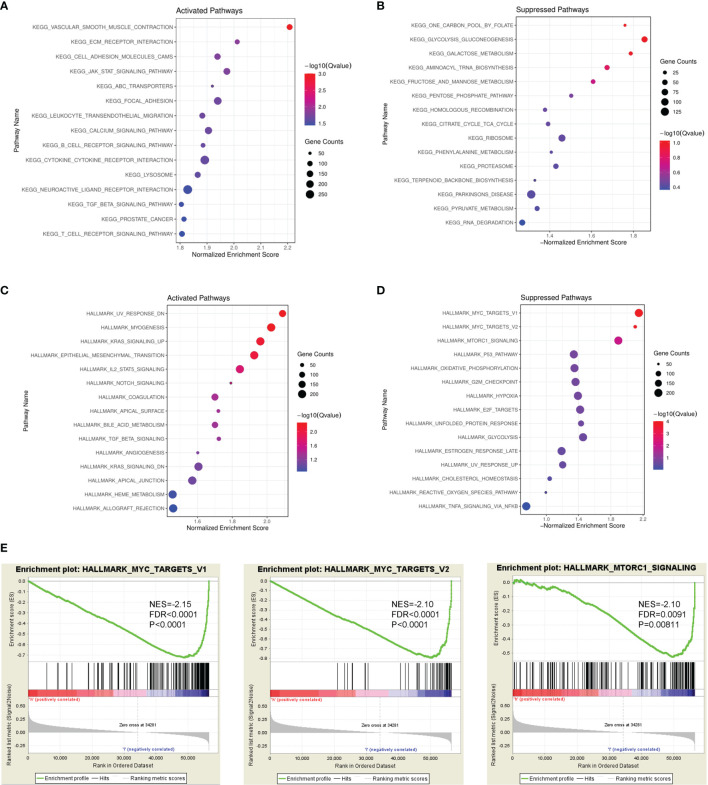
Figure 4.
GSEA identified PAMR1-related signaling pathways. Bubble diagram of the top 15 KEGG pathways enriched by high expression (A) or low expression (B) of PAMR1 in TCGA-CESC data. Bubble diagram of the top 15 Hallmark pathways enriched by high expression (C) or low expression (D) of PAMR1 in TCGA-CESC data. (E) Gene set enrichment plots of the MYC target signaling pathway and mTORC1 signaling pathway in TCGA-CESC data with low PAMR1 expression.

