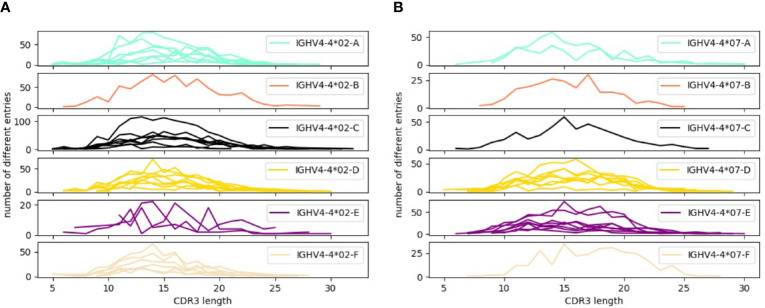
Figure 3.
Distribution patterns of CDR3 length encoded by transcripts associated to 5’UTR-leader sequences of (A) IGHV4-4*02, (B) IGHV4-4*07. For each 5’UTR-leader sequence of a specific allele, the number of filtered reads in each length of CDR3 was counted to create the plots. Every line in the plots represents the 5’UTR-leader sequence from one subject (at maximum 8 subjects were included in each plot). Distribution patterns of CDR3 length for 5’UTR-leader sequences of other alleles are displayed in Supplementary Figure 1 .

