
Figure 3.
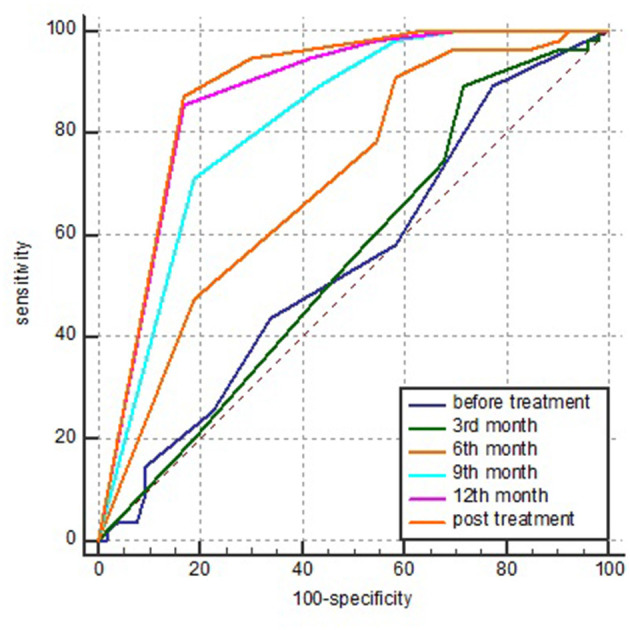
AUC of the sign clusters of cavities detected in various stages of treatment by ROC analysis. AUC, area under the ROC curve and ROC, receiver operating characteristic.
Official websites use .gov
A
.gov website belongs to an official
government organization in the United States.
Secure .gov websites use HTTPS
A lock (
) or https:// means you've safely
connected to the .gov website. Share sensitive
information only on official, secure websites.
AUC of the sign clusters of cavities detected in various stages of treatment by ROC analysis. AUC, area under the ROC curve and ROC, receiver operating characteristic.