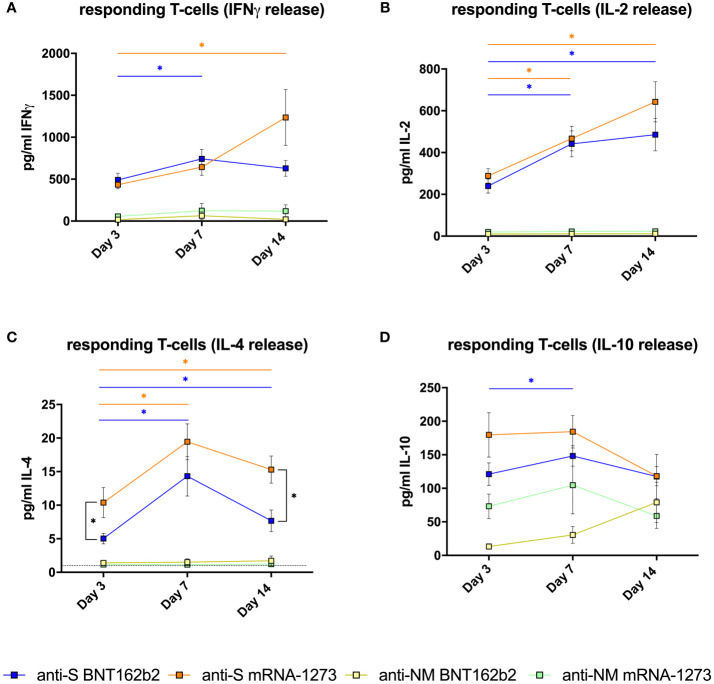
Figure 2.
Specific T-cell responses in vaccinated healthy subjects. (A) Mean±SEM T-cell responses measured by IFNγ release (pg/ml); (B) IL-2 release (pg/ml); (C) IL-4 release (pg/ml) and (D) IL-10 release (pg/ml) (D) after in vitro stimulation with spike-derived peptides pool (S) or mixed nucleocapsid and membrane peptides (NM) from volunteers vaccinated with BNT162 (n=21) or mRNA-1273 (n=19) after 3, 7 and 14 days of receiving the second dose of the vaccine. The dotted line in (C) indicates the lower detection limit of the method for this cytokine, showing that the low concentrations detected are reliable. The linear mixed model was adjusted to evaluate each immunological covariate’s evolution over time in each group. *Significant difference when p < 0.05.

