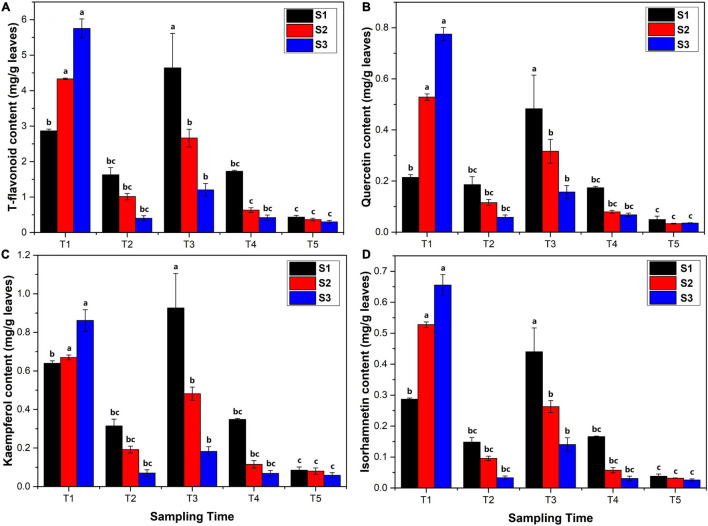
FIGURE 1.
Flavonoid content (mg/kg leaves) analysis in Ginkgo biloba L. extracts determined by high-performance liquid chromatography (HPLC) using gradient elution at 360 nm. (A) The content of total flavonoids. (B) The content of quercetin. (C) The content of kaempferol. (D) The content of isorhamnetin. The error bar was plotted based on the standard deviation of replicate samples.

