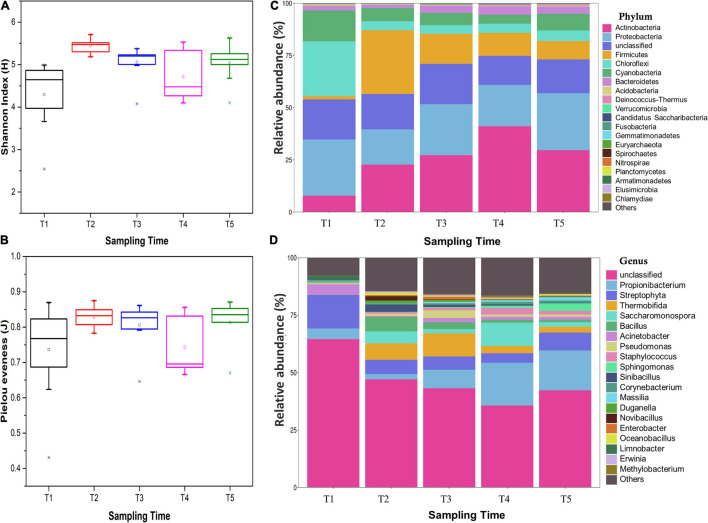
FIGURE 3.
Diversity indexes of endophytic bacterial communities within an individual tree: (A) Shannon index, (B) Pielou evenness, (C) endophytic bacterial relative abundance at the phylum level, and (D) endophytic bacterial relative abundance at the genus level. All indexes were means with standard deviations (SDs) calculated from nine replicates. The different lower case letters following the indexes indicate a significant difference (P< 0.05) between trees.

