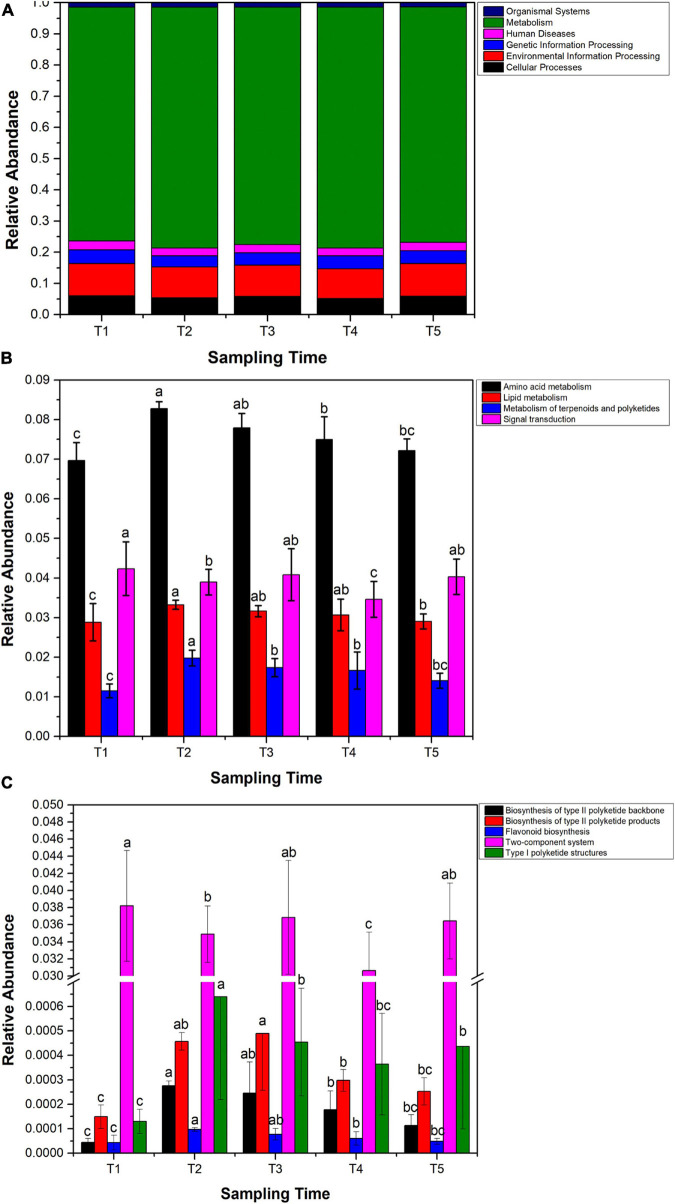
FIGURE 7.
Functional genes analyzed by Tax4Fun2. (A) Relative abundance of predicted functional genes at level I. (B) Relative abundance variation of genes involved in amino acid metabolism, lipid metabolism, metabolism of terpenoids and polyketides, and signal transduction. (C) Changes of relative abundance of predicted genes in the polyketone metabolism, flavonoid biosynthesis, and two-component systems. Samples with different letters indicate that there are significant differences between samples (p < 0.05).

