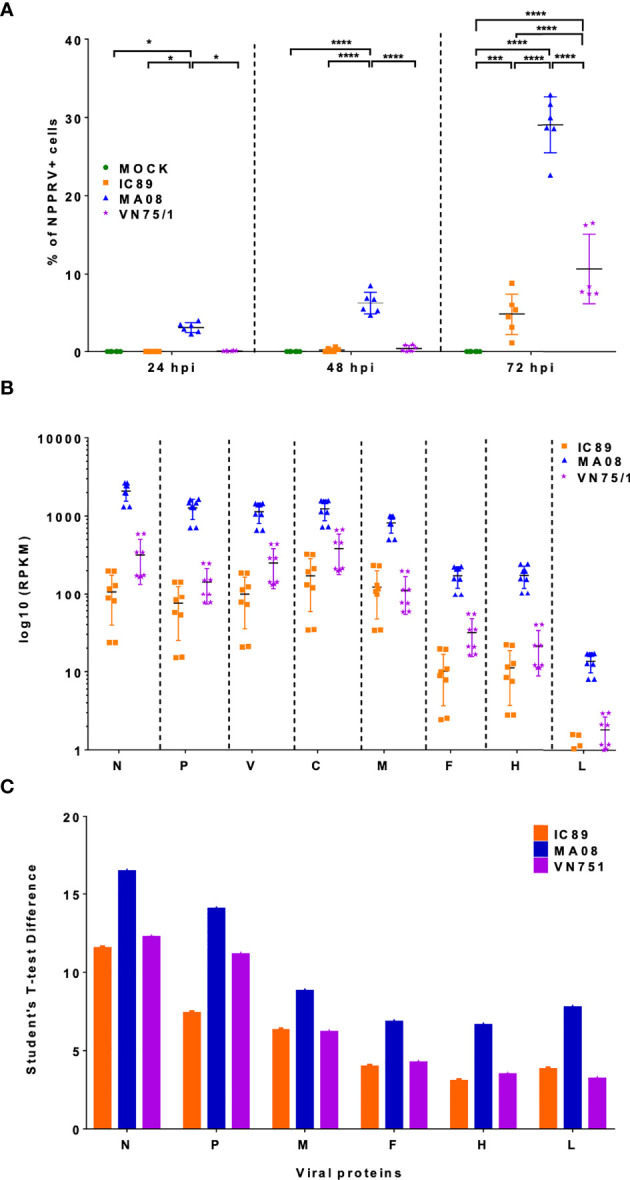
Figure 2.

Detection of viral genes and proteins during PPRV infections of PBMCs. (A) Detection of PPRV N-nucleoprotein positive cells by flow cytometry. P-values were calculated using two-way ANOVA. (B) Distribution of mapped reads of viral genes in RNA sequencing data at 72 hpi. (C) Viral proteins accumulated at 72 hpi and detected by mass spectrometry. Five goats were used to obtain PBMCs. The sixth point observed in 2A represents an additional experiment performed on one animal to confirm the results obtained. P-values were calculated using two-way ANOVA: “*” = P-values < 0.05; “***” = P-values < 0.001; “****” = P-values < 0.0001.
