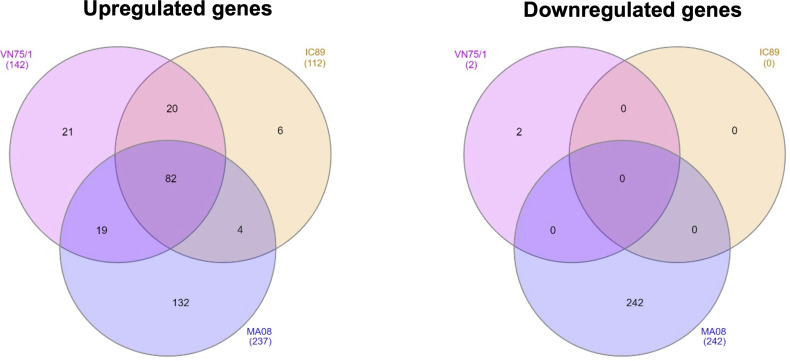
Figure 3.
Venn diagrams of up- and down-regulated genes between PPRV infections determined using DESeq2. Venn diagrams were obtained using InteractiVenn. The gene lists were obtained by comparison with DESeq2 of each infection and the mock control (mock-infected cells) at 72 hpi. A threshold of |Log2FoldChange| >1 and an adjusted p-value < 0.05 were set.

