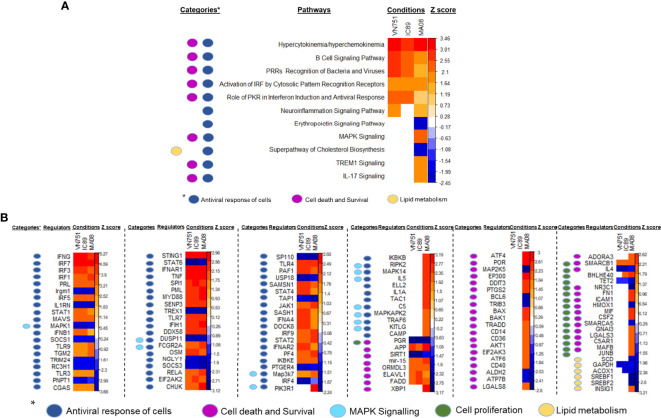
Figure 4.
Identification of pathways and upstream regulators modified by PPRV infections at 72 hpi. Qiagen’s IPA software provided a Zscore that informs on the activation status of pathways (A) and upstream regulators (B). Positive zscores (upregulated) are represented by an orange gradient while negative zscores (downregulated) are represented by a blue gradient. Pathways and upstream regulators have been classified in categories related to antiviral cell responses (dark blue square), MAPK signalling (light blue square), lipid metabolism (yellow square), cell death, survival (violet square) and proliferation (green square).

