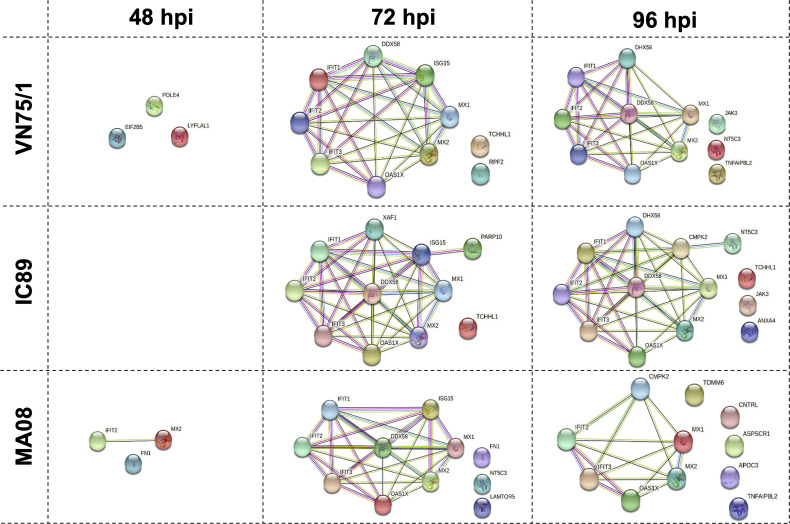
Figure 6.
Protein-protein networks generated during PPRV infections of PBMCs. Data at 48, 72 and 96 hpi were obtained by comparing each infection (VN751, IC89, MA08) to the control (Mock infected cells). Each protein is represented by a different colour circle, picked randomly by the software. The colour of a same protein may differ between each analysis. The colours of the lines between the proteins determine the level of interactions. Known interactions are represented by pink (experimentally determined) and blue (from curated databases) lines. Green (text mining), black (co-expression) and grey (protein homology) lines represent other interactions.

