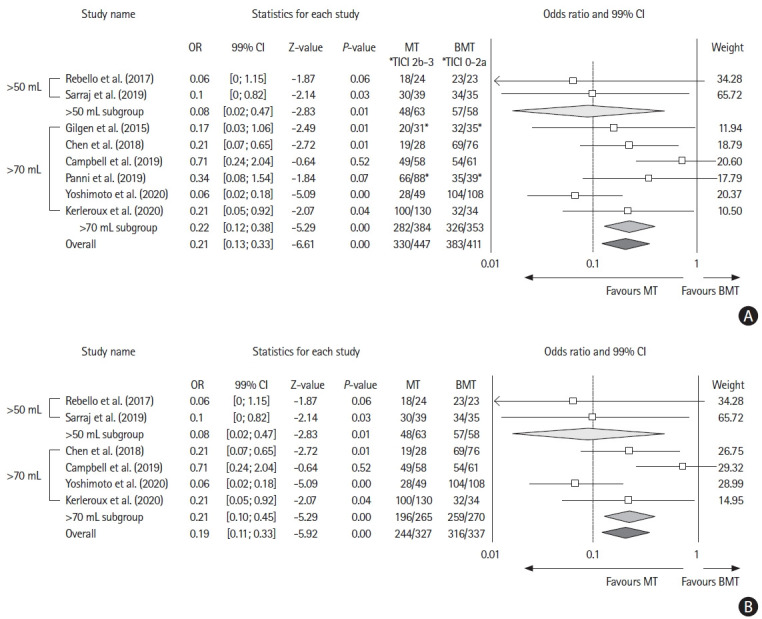
Figure 3.

Forest plot showing the effect on 90-day unfavorable outcome (modified Rankin Scale of 3 or more) of (A) mechanical thrombectomy (MT) vs. best medical treatment (BMT) and (B) MT vs. BMT without considering reperfusion status. OR, odds ratio; CI, confidence interval. *Considering successful reperfusion (thrombolysis in cerebral infarction [TICI] 2b-3) vs. unsuccessful reperfusion (TICI 0-2a).
