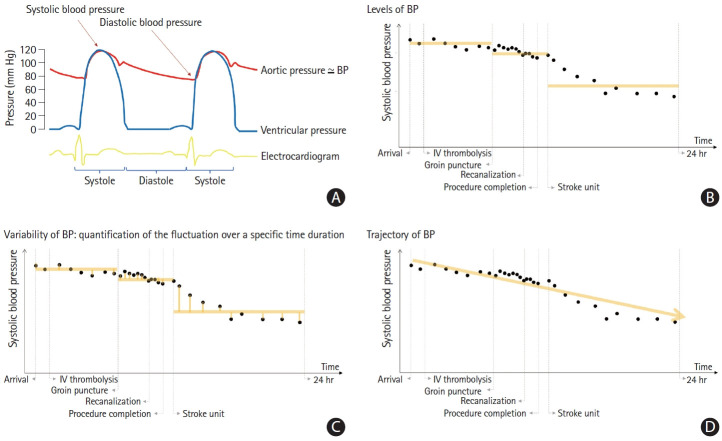
Figure 2.
Characteristics of blood pressure measurements and summary indices. Systolic and diastolic blood pressure (BP) is determined during every cardiac cycle. Intermittent measurements in routine clinical practice may capture only a fraction of the available BP measurements. BP measurements can be obtained repeatedly and exhibit constant fluctuations (A). The measurement density of BPs may be different throughout acute in-hospital care, that is, pre-endovascular treatment (EVT), during the procedure, as well as post-EVT. BP measurements can be summarized using means, as highlighted by the yellow line in the figure. The average BP level is intuitive and easy to calculate, but it does not reflect the variability and fluctuations in BP measurements that occur in a patient (B). Fluctuations of BP can be described by various variability measures, including standard deviations, coefficient of variations, maximum decrements, and average real variability, to name a few. In general, variability measures are calculated by taking the differences between each measurement or the differences between specific values (yellow lines). However, such variability measures do not provide information on the time intervals of the measurements. Thus, the absolute BP variability values may decrease during high measurement density periods such as during EVT procedures (C). The trajectory group describes the overall path (yellow line) of BP measurements over a certain period of time. By using a mixture model, clusters of patients with similar patterns of BP measurements over a period of time may be identified and grouped [104]. Five groups of acute BP trajectories were identified from a clinical registry of 8,000 stroke cases [103]. Trajectory groups are easy to recognize in clinical practice even before the measurement period is completed. However, the trajectory group estimation process depends on the characteristics of the source data and the modeling specification, and thus, the generalizability of the model is limited (D). IV, intravenous.

