-
A
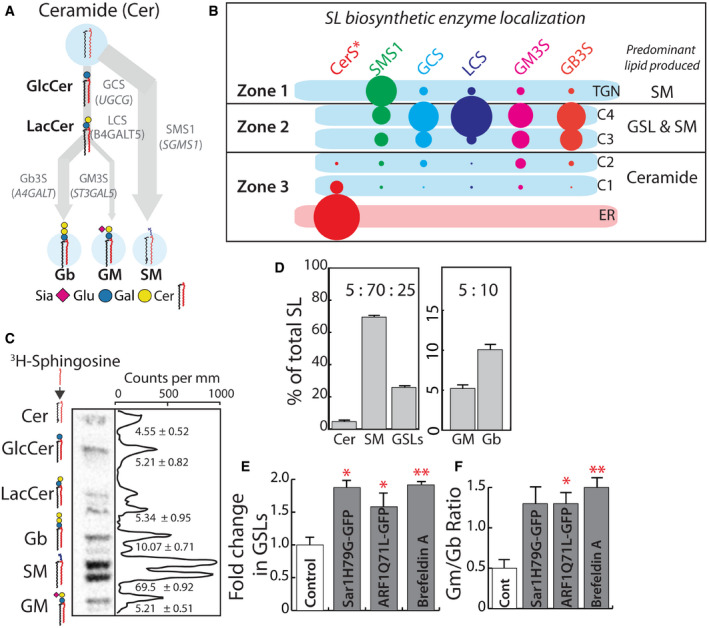
Schematic representation of GSL biosynthetic pathway in HeLa cells (Glu, glucose; Gal, galactose; Sia, N‐acetylneuraminic acid; Cer, ceramide). Products of biosynthesis are represented in bold and enzymes that catalyze the reactions in gray. The arrows represent the SL metabolic flux from ceramide.
-
B
Schematic representation of GSL biosynthetic zones in HeLa, SM biosynthesis predominates in TGN, whereas GSL and SM productions happen in medial/trans‐Golgi (C3 and C4 cisternae). Cis‐Golgi/ER is where Ceramide biosynthesis happens with little, if any, SL production. CerS* refers to the group of Ceramide synthases localized to the ER. The size of the lipid label arbitrarily represents the proportion of the lipid expected to be synthesized in the compartment based on the localization of corresponding enzymes.
-
C
High‐performance thin‐layer chromatography (HPTLC) profile of HeLa cells pulsed for 2 h with [3H]‐sphingosine and chased for 24 h. The peaks corresponding to each SL species are indicated, and numbers represent each SL species as percentage of total SL.
-
D
The total radioactivity associated with Cer, SM, and GSLs (GluCer, LacCer, Gb, and GM), or GM and Gb were quantified and presented as percentages relative to total. Data represented as means ± SD of three independent experiments.
-
E, F
Biosynthesis of SL in HeLa cells expressing GTP‐locked mutants of Sar1 or ARF1 or treated with Brefeldin A (BFA; 5 μg/ml) was measured by [3H]‐sphingosine pulse‐chase assay. Radioactivity associated with GSLs was quantified and represented as fold change with respect to control. (E) For BFA‐treated cells, the SL output was measured 8 h after pulse. Data represented as means ± SD of two independent experiments. *P < 0.05, **P < 0.01 (Student’s t‐test). (F) The ratio of GM/Gb is represented. Data represented as means ± SD of two independent experiments. *P < 0.05, **P < 0.01 (Student’s t‐test).

