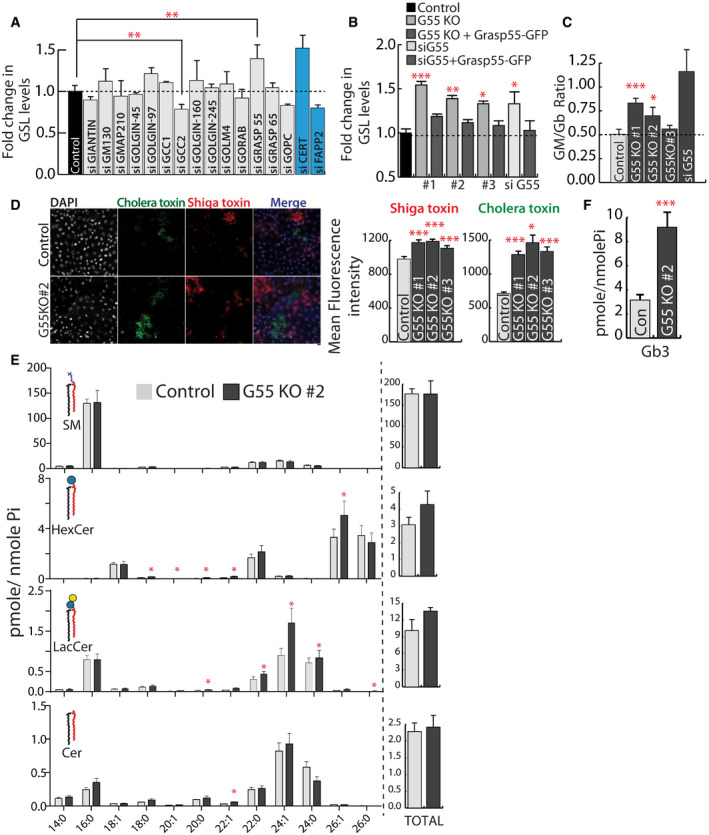
Figure 2. GRASP55 regulates SL biosynthesis.

-
AHeLa cells were treated with control or indicated siRNA (pool of 4 or 2 as indicated in methods) for 72 h and SL biosynthesis measured by [3H]‐sphingosine pulse‐chase assay. GSL levels are expressed as fold changes with respect to control. CERT and FAPP2 knockdowns (blue bars) were used as controls. Data represented are mean ± SD of three independent experiments **P < 0.01 (Student’s t‐test).
-
B, CEffect of GRASP55 depletion on SL biosynthesis monitored by [3H]‐sphingosine pulse‐chase assay in GRASP55 KO cells or cells treated with GRASP55 siRNA or following expression of GRASP55‐GFP in GRASP55 depleted cells. GSL levels are expressed as fold changes with respect to control. Data represented are mean ± SD of three independent experiments *P < 0.05, **P < 0.01, ***P < 0.001 (Student’s t‐test). (C) The levels of GM and Gb were quantified and represented as GM/Gb ratio. Data represented are mean ± SD of three independent experiments *P < 0.05, ***P < 0.001 (Student’s t‐test).
-
DControl and GRASP55KO cells were processed for Cy3‐conjugated Shiga Toxin (ShTxB) and Alexa488‐conjugated Cholera Toxin (ChTxB) staining followed by flow cytometry analysis. Mean fluorescence intensity was measured and represented. Data represented are mean ± SD of three independent experiments *P < 0.05, ***P < 0.001 (Student’s t‐test). Scale bar: 10 μm.
-
E, FSL levels as assessed by LC/MS or MALDI‐MS (Gb3) in control and GRASP55 KO (#2) cells. Data represented are mean ± SD of three independent experiments *P < 0.05, ***P < 0.001 (Student’s t‐test).
