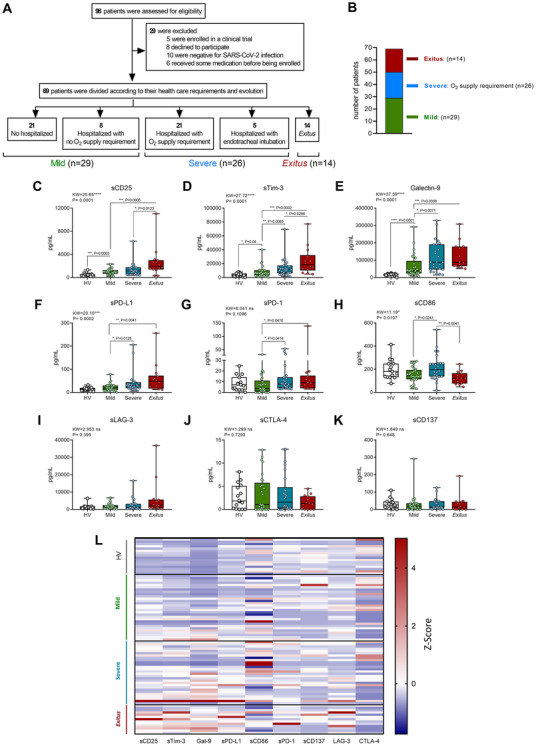
FIGURE 1.

Distribution of patients and plasma immune checkpoint levels according to outcome of patients with COVID‐19 on admission, compared with HVs. (A) and (B) Distribution of patients with COVID‐19 in the severity groups according to evolution and their oxygen requirement during their stay: mild (n = 29); severe (n = 26); and exitus (n = 14). Quantification of plasma soluble immune checkpoints according to disease severity of patients with COVID‐19 on admission compared with HVs: sCD25 (C), sTim‐3 (D), Galectin‐9 (E), sPD‐L1 (F), sPD‐1 (G), sCD86 (H), sLAG‐3 (I), sCTLA‐4 (J) and sCD137 (K). (L) Heatmap of plasma immune checkpoints levels Z‐score of HVs and patients with COVID‐19 on admission according to the severity group: mild (1); severe (2); and exitus (3) is shown. (C–D) Data are shown as pg/mL and were analysed by Kruskal–Wallis and Mann–Whitney U tests. Data are presented in box‐and‐whisker plots (min to max). *p < .05; **p < .01; ***p < .001; ****p < .0001; KW, Kruskal–Wallis statistic
