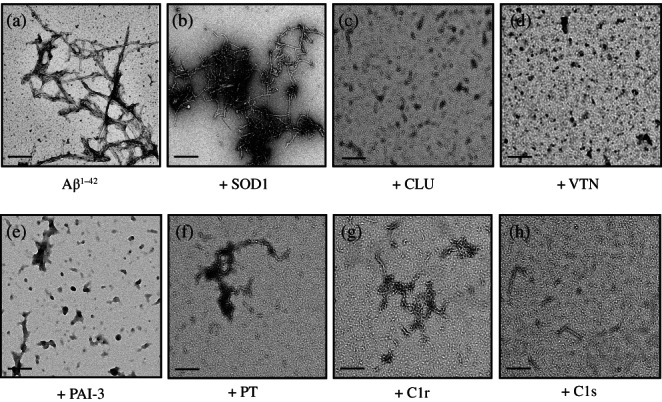
FIGURE 4.

Transmission electron microscopy images of samples collected at the 60 hr endpoint from 10 μM Aβ1–42 aggregation reactions. In (a), Aβ1–42 was aggregated alone without any additions. Other samples were supplemented with 1 μM of (b) SOD, (c) CLU, (d) VTN, or (e) PAI‐3, or 2 μM of (f) C1r, (g) C1s, or (h) PT. In all cases, the black scale bars (bottom left of panels) represent 200 nm
