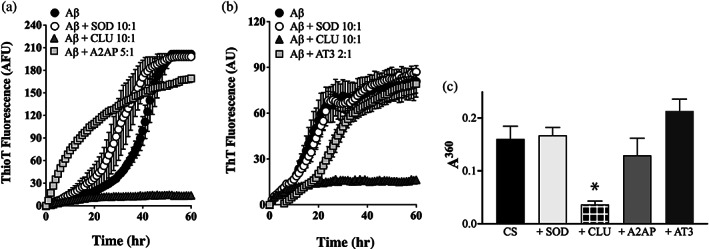
FIGURE 5.

A2AP and AT3 have very limited abilities to inhibit the aggregation of Aβ1–42 or CS. (a, b) Aβ1–42 (10 μM) was supplemented with ThioT (20 μM) and incubated for 60 hr in the absence or presence of 1 μM SOD (a non‐chaperone control protein) or CLU (a chaperone control protein). Aggregation reactions were also supplemented or not with (a) 2 μM A2AP or (b) 5 μM AT3; the molar ratio of Aβ1–42:test protein are indicated in the respective keys. Amyloid formation was monitored by measuring ThioT fluorescence. Mean ThioT fluorescence values (in arbitrary fluorescence units, AFU) ± SEM (n = 3) are plotted. In (a) and (b), in some cases, the error bars are too small to be visible. Results shown are representative of three independent experiments. (c) Endpoint absorbance values following an 8 hr incubation of 5 μM CS in the presence or absence of 1 μM of SOD or CLU, or 5 μM of A2AP or AT3. Amorphous protein aggregation was monitored as turbidity measured as absorbance at 360 nm (A360). Mean endpoint absorbance values ± SEM (n = 3) are plotted. The asterisk indicates a significant difference in A360 between the CS alone and +CLU treatments (Student's t‐test, p < .01); other differences are not significant. Each result is representative of two independent experiments
