
FIGURE 1.
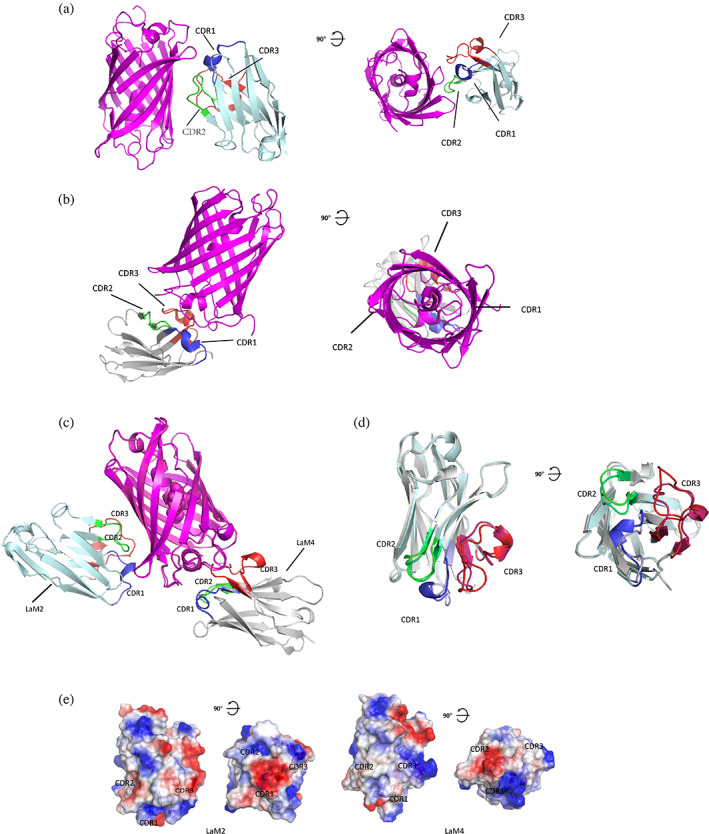
Structure of mCherry: mCherry‐specific nanobody complex determined by X‐ray crystallography. (a) Overall structure of LaM2‐mCherry complex. mCherry is shown in purple. LaM2 is shown in light blue, and CDR1–3s are shown in blue, green, and red (PDB ID: 6IR2). (b) Overall structure of the LaM4‐mCherry complex. mCherry is shown in purple. LaM4 is shown in gray, and the complementarity determining regions (CDRs) are shown in blue (CDR1), green (CDR2), and red (CDR3) (PDB ID: 6IR1). (c) Alignment of LaM2 (light blue)‐mCherry and the LaM4 (gray)‐mCherry complex. (d) Alignment of nanobodies LaM2 and LaM4. (e) Comparison of the surface potential of nanobodies LaM2 and LaM4 (blue: positive, red: negative)